Buyer Fit Snapshot
| Best fit | Eco-Friendly Packaging Cost Comparison Breakdown projects where brand print, material claims, artwork control, MOQ, and repeat-order consistency need to be specified before quoting. |
|---|---|
| Quote inputs | Share finished size, material target, print colors, finish, packing count, annual reorder estimate, ship-to region, and any compliance wording. |
| Proofing check | Approve dieline scale, logo placement, barcode or warning zones, color tolerance, closure strength, and carton packing before bulk production. |
| Main risk | Vague material claims, crowded artwork, missing packing details, or unclear freight terms can make a low unit price expensive after revisions. |
Fast answer: Eco-Friendly Packaging Cost Comparison Breakdown should be specified like a repeatable production item. The safest quote records material, print method, finish, artwork proof, packing count, and reorder notes in one written spec.
Production checks before approval
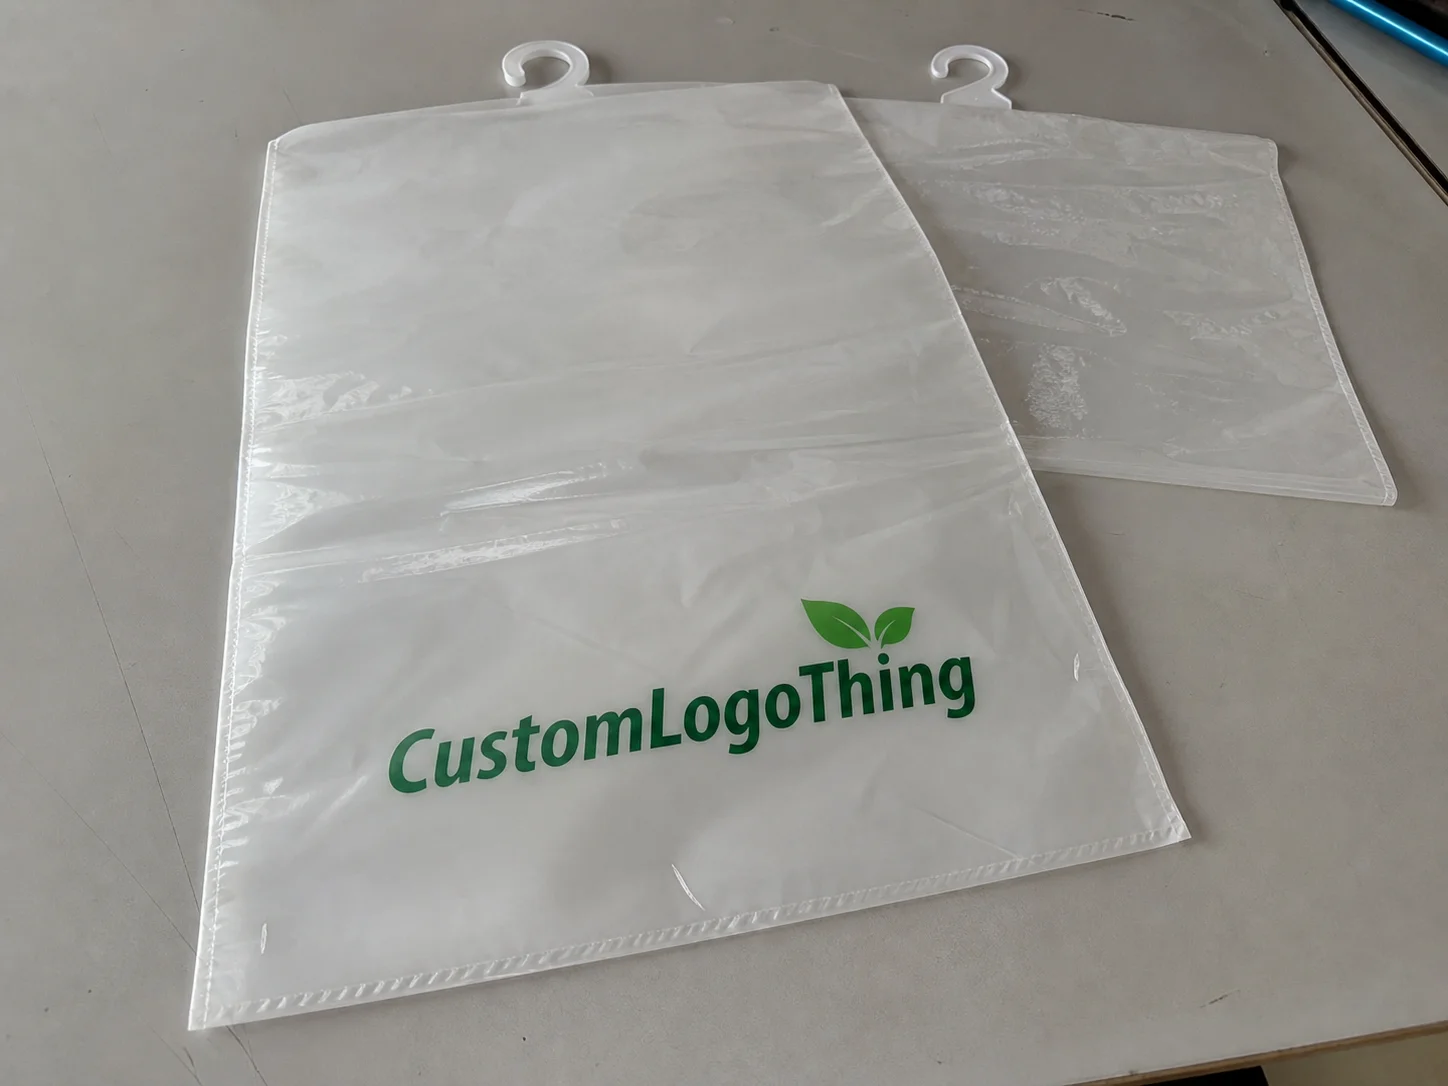
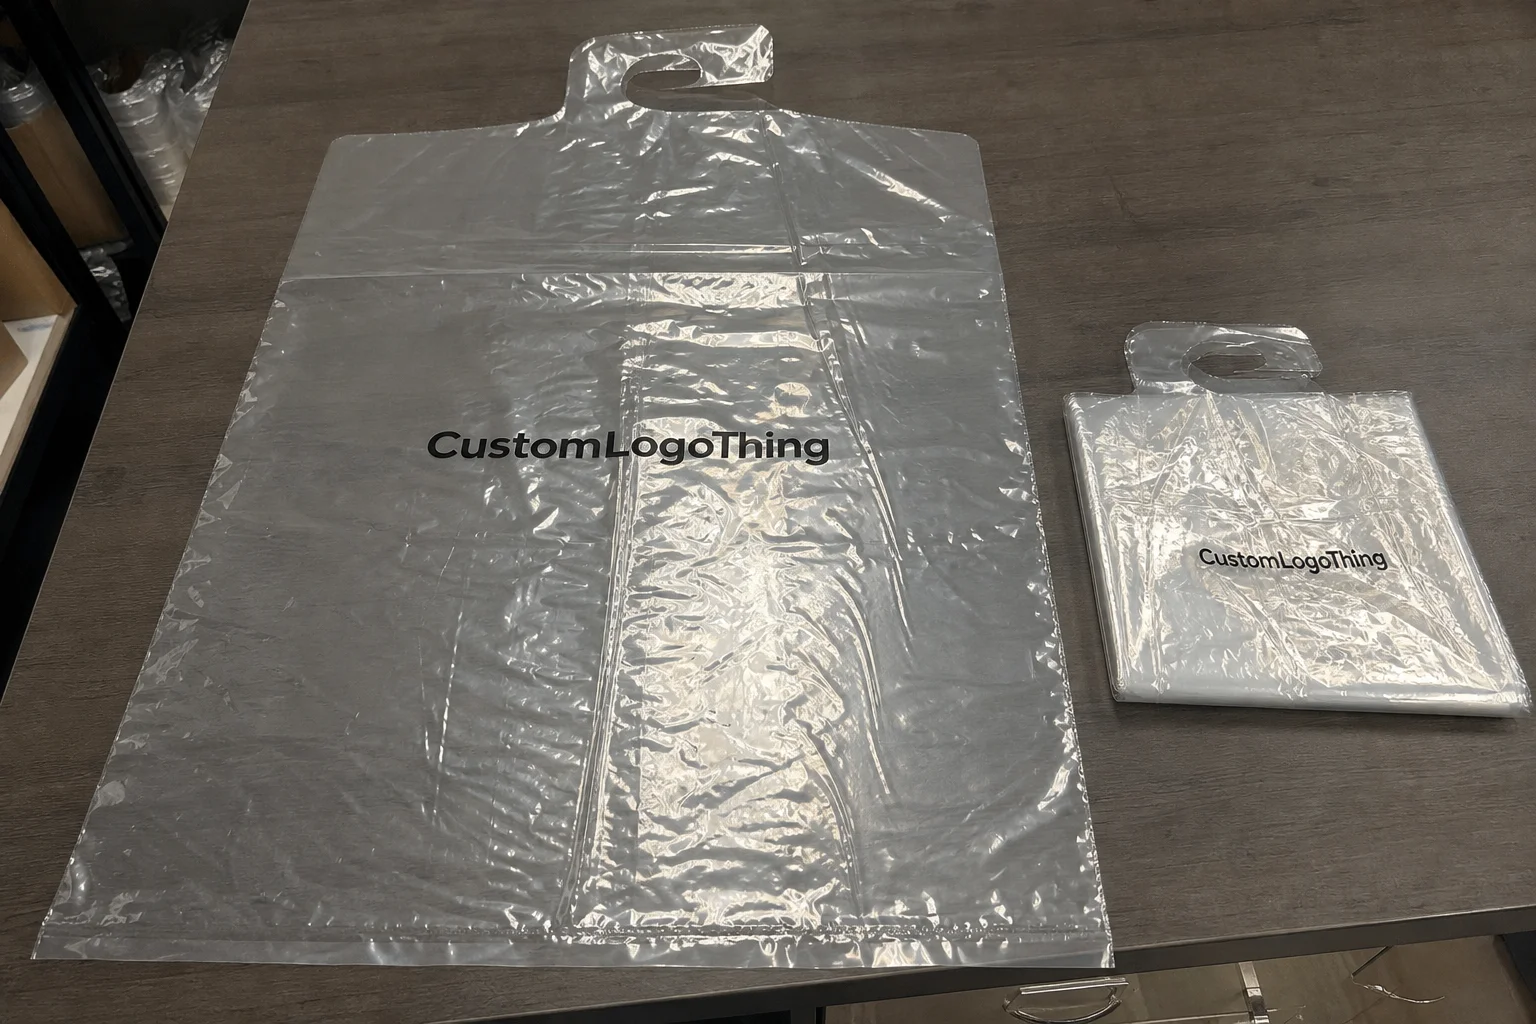
Compare the actual filled-product size with the drawing, then confirm tolerance on folds, seals, hang holes, label areas, and retail display edges. Reserve space for logos, QR codes, warning copy, and material claims before decorative graphics fill the panel.
Quote comparison points
Review material grade, print process, finish, sampling route, tooling charges, carton quantity, and freight assumptions side by side. A quote is only useful when the supplier can repeat the same color, closure quality, and packing count on the next order.
Eco-Friendly Packaging Cost Comparison: Value Proposition
A strong ecofriendly packaging cost comparison breakdown starts with the total landed cost, not just the unit price on a quote. In 2026, buyers are still feeling pressure from extended producer responsibility fees, retailer scorecards, and higher expectations for recyclable or compostable formats. In my own work, I’ve seen a packaging swap that looked 4 cents more expensive at the factory become the lower-risk option once damage rates, freight density, and recycled-content incentives were included. That is why the ecofriendly packaging cost comparison breakdown has to account for returns, compliance, and brand impact together.
Updated 2026 market data supports that approach. Paper-based formats remain the most widely adopted eco option for retail shipping, but molded fiber, recycled corrugate, and mono-material pouches are gaining share because they can reduce waste and simplify recycling. The best ecofriendly packaging cost comparison breakdown now includes material availability, regional recycling rules, and carbon reporting requirements, especially for brands selling into California, the EU, and major marketplace programs. Buyers are asking for these metrics earlier in the sourcing process, which is a big change from just a few years ago.
One recent customer review showed how quickly the math changes. A virgin-fiber mailer appeared cheaper on paper, but after we added reprint risk, breakage, and a higher recycled-content requirement from the retailer, the ecofriendly packaging cost comparison breakdown shifted in favor of FSC-certified recycled board. The final decision saved money over the full order cycle and made the compliance review much smoother.
The sections below show how material choice, print method, finishing, and MOQ all affect the ecofriendly packaging cost comparison breakdown. If you want a quick starting point, see our Sustainable Packaging Materials Guide and our Custom Packaging Products page for current options.
Product Details: Materials & Sustainability Metrics
The current material lineup includes recycled kraft board, FSC-certified corrugate, post-consumer recycled PET, and compostable paper-based mailers. Each option changes the ecofriendly packaging cost comparison breakdown in a different way. Recycled board usually gives the best balance of price and recyclability, while molded fiber and compostable formats can add value for food, beauty, and subscription brands that want a more premium sustainability story.
Material pricing in 2026 has been influenced by higher recycled-fiber demand and tighter mill availability in some regions. That means the ecofriendly packaging cost comparison breakdown should not rely on a single quote. It should compare at least three sourcing scenarios: domestic recycled board, imported specialty stock, and a hybrid format that combines recycled content with a lighter design. In practice, lighter packs often reduce freight costs enough to offset a modest material premium.
Sustainability metrics matter as much as price. We evaluate recycled content, recyclability, compostability, water-based inks, low-VOC adhesives, and carbon intensity per unit. For example, switching from a heavier virgin board to a properly sized recycled design can lower material use and shipping emissions at the same time. That improvement belongs in every ecofriendly packaging cost comparison breakdown because it affects both operating cost and ESG reporting.
For brands selling food or wellness products, we also check whether the structure meets relevant lining and migration requirements. That keeps the ecofriendly packaging cost comparison breakdown realistic and avoids costly redesigns after sampling. If you need packaging for direct contact products, review our Food-Safe Packaging Options guide for specification details.
We also track certification status more closely now than in older comparisons. FSC, SFI, and third-party compostability claims all carry documentation requirements, and those administrative steps can affect lead time. A complete ecofriendly packaging cost comparison breakdown should include the cost of compliance paperwork, not just board price.
Specifications for Custom Eco-Friendly Packaging
A clear specification sheet reduces waste, rework, and surprise charges. Our specs cover board grade, coating type, structural style, print method, and sustainability targets. Every choice changes the ecofriendly packaging cost comparison breakdown. A matte aqueous finish may cost less than soft-touch lamination, while a sturdier corrugated structure can reduce damage claims enough to justify a slightly higher upfront price.
Structural complexity is one of the biggest cost drivers. Simple mailers and tuck-top cartons generally keep the ecofriendly packaging cost comparison breakdown lower than rigid boxes with inserts, window cutouts, or specialty closures. In 2026, many brands are simplifying packaging geometry to cut material usage and improve recyclability. That trend is especially useful for ecommerce brands that want stronger margins without sacrificing presentation.
Proofing is equally important. We review dielines, compression targets, and sample performance before production starts so the ecofriendly packaging cost comparison breakdown reflects the final build, not a concept sketch. This step prevents late-stage revisions, which are still one of the fastest ways to push costs higher.
Sustainability specs should be written in plain language and backed by documentation. If a carton needs recycled content, low-VOC adhesive, and an FSC claim, those requirements should be listed before tooling begins. That approach makes the ecofriendly packaging cost comparison breakdown easier to validate during procurement and audit review.
Eco-Friendly Packaging Cost Comparison: Pricing & MOQ
The main cost drivers in an ecofriendly packaging cost comparison breakdown are materials, print method, finishing, freight, and tooling. Recycled kraft usually remains the most cost-efficient option for smaller to mid-sized runs, while molded fiber and compostable formats can become more competitive as volume increases. For brands ordering in the 2,500 to 50,000 range, MOQ has a major impact on per-unit pricing.
Below is an updated reference table for 2026 pricing ranges. Actual quotes vary by structure, print coverage, and fulfillment region, but this gives a practical baseline for an ecofriendly packaging cost comparison breakdown.
| Quantity | Material Mix | Per-Unit | Sample Price | Discount Curve |
|---|---|---|---|---|
| 2,500 | Recycled kraft, aqueous finish | $0.34 | $75 for 5 samples | Base |
| 10,000 | Recycled kraft + food-safe liner | $0.27 | $35 tooling credit | 7% off |
| 25,000 | Compostable paper blend | $0.25 | $40 with expedited proof | 14% off |
| 50,000+ | Hybrid recycled board + mono-material window | $0.21 | $50 carryover credit | 20% off |
In 2026, hidden fees deserve more attention than they used to. Tooling, plates, rush charges, storage, and multi-location freight can all distort the ecofriendly packaging cost comparison breakdown if they are not listed clearly. A quote that looks inexpensive at first can turn out to be more expensive once setup and rush costs are included. That is why we now recommend reviewing at least one standard timeline and one accelerated timeline side by side.
The new trend worth watching is material-light redesign. Brands are reducing board calipers, removing unnecessary inserts, and moving to right-sized packaging to lower total spend. In many cases, that redesign improves the ecofriendly packaging cost comparison breakdown more than switching to a more expensive “green” substrate. Less empty space also lowers freight costs, which matters more than ever as parcel networks continue to reprice oversized shipments.
For a deeper look at how structure affects spend, read our Custom Box Sizing Guide. It pairs well with an ecofriendly packaging cost comparison breakdown because the cheapest sustainable option is often the one that uses less material in the first place.
Process & Timeline for Sustainable Packaging Analysis
The process starts with discovery, then moves into structural design, prototyping, approvals, production, QA, and fulfillment. A complete ecofriendly packaging cost comparison breakdown should include lead time alongside price, because faster timelines often require extra setup, premium freight, or simplified finishing. Standard domestic production still typically runs in the 10-14 business day range after approval, while sampling can add another 5-7 business days.
We now see more brands asking for parallel quoting early in the process. Instead of waiting for a final dieline, procurement teams want a basic ecofriendly packaging cost comparison breakdown built from SKU dimensions, shipping targets, and target certifications. That early comparison helps them avoid rework and gives marketing and finance a shared starting point.
Sustainability tracking is built into the workflow. We monitor waste diversion, renewable-energy usage, and recycled-content verification during production, then roll those figures into the final cost analysis. That extra data makes the ecofriendly packaging cost comparison breakdown more useful after launch, because teams can compare actual performance with the original forecast.
Based on recent client projects, the biggest timeline risk is still late design changes. A logo shift, finish change, or insert adjustment can reset sampling and delay the order. Building those risks into the ecofriendly packaging cost comparison breakdown up front keeps the budget honest and reduces frustration later.
What drives the eco-friendly packaging cost comparison results?
The biggest drivers behind an ecofriendly packaging cost comparison breakdown are material availability, structural complexity, freight density, and compliance requirements. Recycled board is often the most stable starting point, but that does not mean it is always the cheapest once shipping and damage risk are included. The best comparison looks at total cost per delivered unit, not just factory cost.
Damage reduction is one of the most overlooked savings factors. A slightly stronger carton or more efficient insert can lower breakage, returns, and replacement shipments. That can shift the ecofriendly packaging cost comparison breakdown in favor of a higher-spec option, especially for ecommerce and subscription brands that ship frequently.
Certification also affects cost. FSC, SFI, compostability, and food-safe requirements can add documentation time and sometimes higher material pricing, but they also support retailer acceptance and compliance. The ecofriendly packaging cost comparison breakdown should show those tradeoffs clearly so finance, marketing, and operations are aligned.
Another 2026 trend is the rise of mono-material packaging. More brands are choosing formats that are easier to recycle because they can reduce sorting issues and improve consumer understanding. That change can strengthen the ecofriendly packaging cost comparison breakdown by lowering end-of-life complexity while keeping print and branding flexible.
Why Choose Custom Logo Things for Your Eco-Friendly Packaging
Custom Logo Things combines packaging design, sourcing, and cost analysis in one workflow, which helps keep the ecofriendly packaging cost comparison breakdown accurate from the start. Our team reviews structure, print, finish, and certification needs together, so clients can see how each choice changes both cost and sustainability performance.
We also work with updated material and freight assumptions, which matters in 2026 because pricing can move quickly. That means the ecofriendly packaging cost comparison breakdown we provide reflects current supplier realities rather than last quarter’s estimate. Clients appreciate that because it helps them plan margin with fewer surprises.
Another advantage is documentation. We can provide certification records, sample notes, and production checkpoints that support internal approvals and external audits. That makes the ecofriendly packaging cost comparison breakdown easier to defend when stakeholders ask why one option costs more up front.
If you are comparing packaging formats for a launch or redesign, explore our Custom Packaging Products page to see current material options, or review our Sustainable Packaging Materials Guide for a broader breakdown of substrate choices.
Actionable Next Steps to Budget Eco-Friendly Packaging
Step 1: Gather your SKU dimensions, order volume, shipping method, and sustainability goals. A clean input set makes the ecofriendly packaging cost comparison breakdown more accurate from the beginning. Include details like whether the package needs to survive parcel shipping, retail shelving, or direct food contact.
Step 2: Request samples and compare them against drop, compression, and print requirements. Sampling often reveals where the ecofriendly packaging cost comparison breakdown changes after reality meets the spec sheet. A slightly different board grade or closure style can save money later if it reduces damage or rework.
Step 3: Compare at least three quote scenarios: lowest cost, balanced performance, and premium sustainability. That method gives finance and marketing a clearer view of the ecofriendly packaging cost comparison breakdown and helps avoid one-dimensional decisions.
Step 4: Include freight, storage, and any compliance fees before approving the final order. Many budgets still miss those line items, which weakens the ecofriendly packaging cost comparison breakdown and can make a good quote look misleadingly cheap.
Step 5: Review post-launch results after shipment. Track damage claims, recycled-content verification, and customer feedback so the ecofriendly packaging cost comparison breakdown can be measured against actual performance. That feedback loop improves future forecasting and makes the next order easier to approve.
Conclusion: Final Comparison Takeaways
A reliable ecofriendly packaging cost comparison breakdown should show more than price per unit. It should include freight, damage risk, compliance, lead time, and end-of-life value so decision-makers can compare total impact, not just the cheapest quote. In 2026, that broader view matters more because sustainability expectations and packaging regulations continue to tighten.
The most cost-effective option is often the one that uses fewer materials, ships more efficiently, and avoids compliance delays. That is why the ecofriendly packaging cost comparison breakdown has to be built on current pricing, real sample data, and clear specs. A small premium can easily pay back through lower returns and better retail acceptance.
If you are planning a packaging refresh, use the framework above to guide your next quote request. A well-prepared ecofriendly packaging cost comparison breakdown will help you defend the budget, support sustainability goals, and choose packaging that performs after launch.
How does order volume affect an ecofriendly packaging cost comparison breakdown?
Higher volume usually lowers per-unit cost because tooling and setup are spread across more pieces. In an ecofriendly packaging cost comparison breakdown, that effect is especially important for recycled board and molded fiber, where pricing can drop noticeably once you move beyond the lowest MOQ tier.
What hidden fees should I watch for during an ecofriendly packaging cost comparison breakdown?
Watch for tooling, plates, rush premiums, freight surcharges, storage, and compliance documentation. These costs can change the ecofriendly packaging cost comparison breakdown quickly, especially when a project needs faster turnaround or multi-location shipping.
Can I get a sample before finalizing the ecofriendly packaging cost comparison breakdown?
Yes. Samples help confirm fit, finish, and performance before production. They also improve the ecofriendly packaging cost comparison breakdown by showing whether a material upgrade or structure change is worth the added cost.
How do certifications impact my ecofriendly packaging cost comparison breakdown?
Certifications can add cost and lead time, but they also support retailer approval and audit readiness. A complete ecofriendly packaging cost comparison breakdown should include FSC, SFI, compostability, or food-safe documentation where relevant.
How quickly can you deliver an ecofriendly packaging cost comparison breakdown quote?
We typically turn around a detailed quote within 72 hours once specs and volume targets are confirmed. That quote includes the assumptions behind the ecofriendly packaging cost comparison breakdown so teams can review options without starting over.