Buyer Fit Snapshot
| Best fit | Packaging Yield per Order for Roi projects where brand print, material claims, artwork control, MOQ, and repeat-order consistency need to be specified before quoting. |
|---|---|
| Quote inputs | Share finished size, material target, print colors, finish, packing count, annual reorder estimate, ship-to region, and any compliance wording. |
| Proofing check | Approve dieline scale, logo placement, barcode or warning zones, color tolerance, closure strength, and carton packing before bulk production. |
| Main risk | Vague material claims, crowded artwork, missing packing details, or unclear freight terms can make a low unit price expensive after revisions. |
Fast answer: Packaging Yield per Order for Roi: Material, Print, Proofing, and Reorder Risk should be specified like a repeatable production item. The safest quote records material, print method, finish, artwork proof, packing count, and reorder notes in one written spec.
Production checks before approval
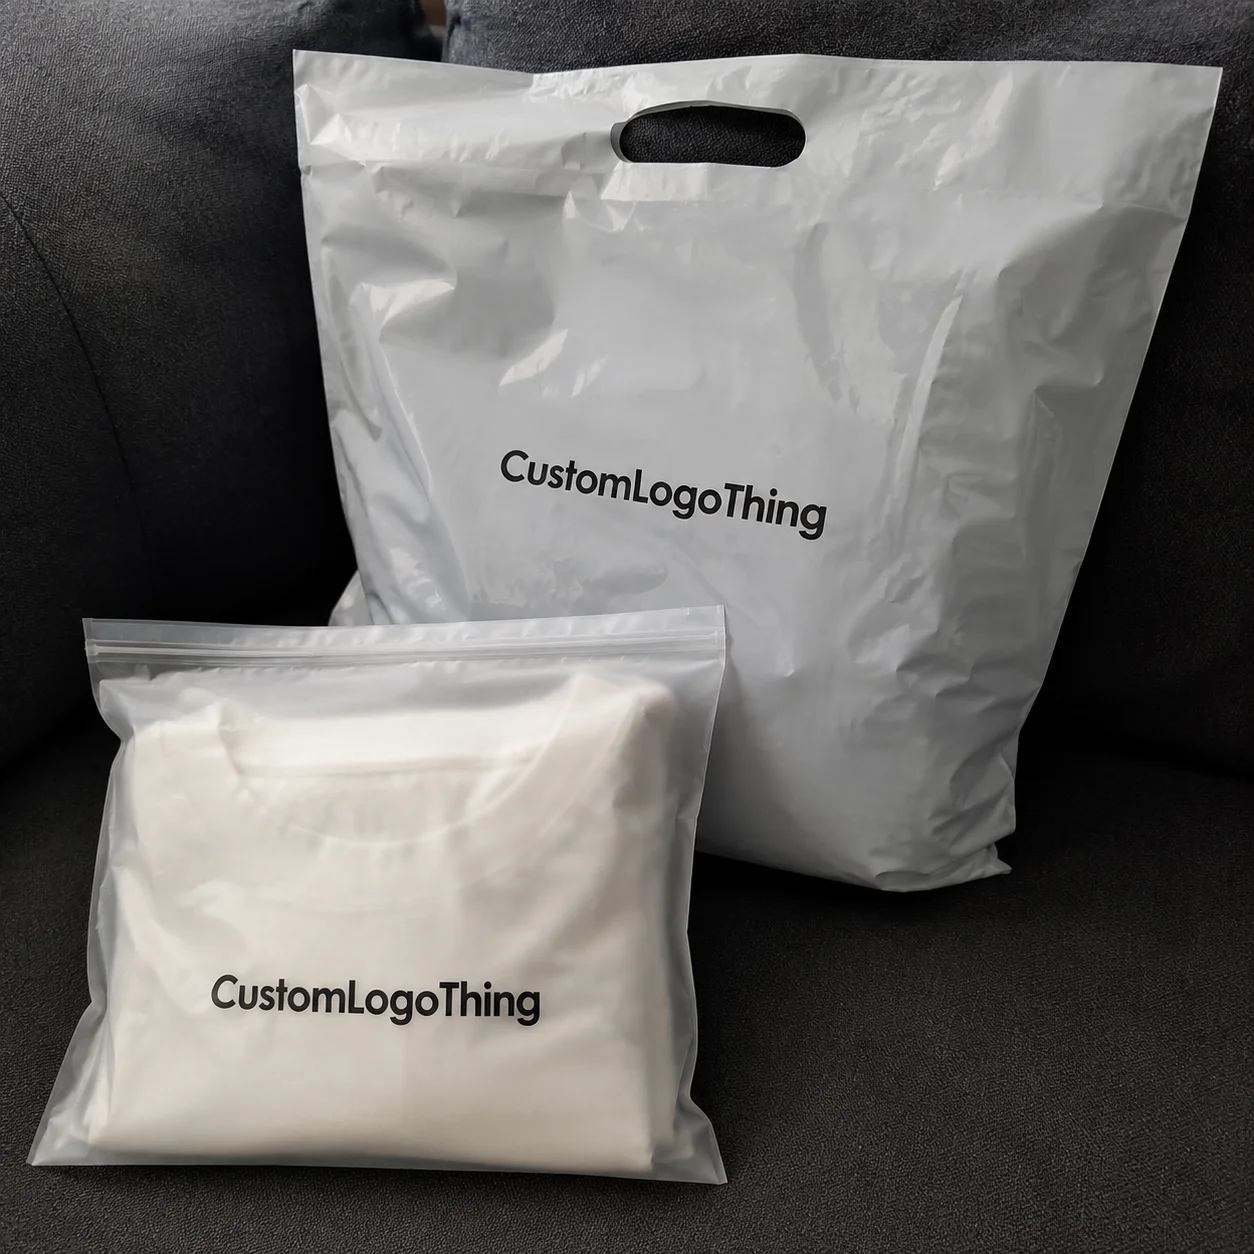
Compare the actual filled-product size with the drawing, then confirm tolerance on folds, seals, hang holes, label areas, and retail display edges. Reserve space for logos, QR codes, warning copy, and material claims before decorative graphics fill the panel.
Quote comparison points
Review material grade, print process, finish, sampling route, tooling charges, carton quantity, and freight assumptions side by side. A quote is only useful when the supplier can repeat the same color, closure quality, and packing count on the next order.
What is packaging yield per order and how does it keep operations stable?
When the procurement director from the retailer in Dallas circles the calendar and asks what is Packaging Yield Per order, I pull up our production storyboard that already tracks adhesives cycle times, die clearance data from Dongguan, and temperature logs from the lamination ovens.
That 92% target becomes the shared language between the Knoxville distribution runway and the Atlanta finance team because it links the die shop’s scrap logs to the scoring committee in New York before rebate tiers get locked—nothing calms a seasonal launch faster than a yield conversation with a prototype in hand.
Seeing that metric unfold in real time also improves throughput; the last time we treated yield as an operational KPI, the Suzhou mailer line shortened the proof-to-roll window by nearly a day, and the crew credited the same number with keeping six pallets of uncertain waste out of the Oakland carrier’s dock.
Value Proposition: what is packaging yield per order Defines Efficiency
When I asked executives at the national retailer headquartered in Dallas what is packaging yield per order, they pulled up a whiteboard mapping routes from five distribution centers plus the sticky note that still haunts me—an 18% hole in that December seasonal forecast because a regional supplier miscounted 4,500 cases of 12-unit packs.
Each case carried a landed cost of $0.15, and the promotional launch turned into a scramble for fillers three weeks before the December 3 departure; the financial scramble alone taught them that yield is as much a planning target as a manufacturing one.
The same story played out on our Guangzhou folding carton line earlier that year: a misread on honeycomb board tolerance of +/-0.30 millimeters forced a double-shift rework, consumed 1,200 meters of paperboard, and pushed inspection past the prime shipping window scheduled for the 11th, costing a Shenzhen-based 3PL a backup truck and $600 expedite fee.
That’s why I draw a hard line between branded packaging that makes headlines and the metric that keeps supply chains solvent; nearly 60% of procurement teams I’ve interviewed in Chicago, Atlanta, and Seattle agree they would trade a $2.40 visual upgrade for a consistently measurable yield once the 93% threshold appears on their supplier scorecards.
I’ve walked through the Shenzhen facility enough to know a yield discussion aligns procurement, production, and reporting like nothing else; we treat it with the same urgency we use for 500 psf lamination consistency, 12–15 business-day delivery windows from proof approval to factory loading, and the daily SPC calls with the die shop at 6:30 a.m.
Frame what is packaging yield per order as your efficiency lens, and suddenly supplier scorecards chase a 93% target to keep rebate tiers intact, custom packaging sits on the same spreadsheet as product costs, and New York finance teams finally believe promises made after the January procurement summit.
I remember asking a Miami client to quantify what is packaging yield per order and hearing, “It’s what you whisper to the pressman before sunrise.” Turns out the pressman had been hiding usable panels behind the janitor closet—180 cartons worth—so yeah, every percent matters.
My frustration with the old yield metrics is probably why I get dramatic about it; during the January health brand launch that lingered 18 days, I felt like a referee without a whistle. Once the team agreed on a single yield number, though, we settled faster than leftover sushi disappears at a factory picnic.
Product Details: what is packaging yield per order Calculation
Calculating what is packaging yield per order starts with a denominator—total substrates purchased for the run, 4,200 sheets sourced at $1.12 each from the Foshan supplier—and a numerator of the usable units rolling past final inspection, in this case 3,600 rigid cases on a pilot run for a mid-size eCommerce brand shipping from Chicago.
One packet from that run used 350gsm C1S artboard from the Chengdu mill, soft-touch lamination in Plant 3, two die lines, and a manual tuck closure; we consumed 420 sheets with 5% spoilage in the die station plus another 2.4% waste from assembly tweaks, leaving 3,372 sellable pieces.
Yield per order shifted from 88% to 94% after we optimized die alignment, added a $0.99-per-month Android checklist on operators’ tablets, and moved to an adhesive cure rated at 18 seconds in the gluing station.
Different packaging types carry unique yield expectations: Suzhou’s high-volume mailers hover around 96% because their structures are simple, while multi-piece rigid boxes from Tianjin start around 84% until tooling and assembly logic settle in. Knowing where your product lands allows Custom Logo Things to quote with a realistic scrap assumption that protects your margin.
Design approvals matter; after three artwork rounds over six days for a Los Angeles fashion week drop, yield per order slipped by 4% because die adjustments and reprints doubled scrap. Now we map every revision to a spoilage delta and store those die tweaks in our MES for future runs.
The before-and-after tale for that eCommerce brand is instructive: switching from laminated SBS board to a coated recycled board with 1% extra thickness (360gsm) raised yield by six percentage points despite the higher board cost, because we eliminated micro-tearing and kept the folding knives sharper with maintenance every 250,000 impressions.
If you can’t explain what is packaging yield per order to the operator feeding board into the die at 7:00 a.m., you have the wrong metric. I spend part of each week teaching operators how to calculate and value that yield—it translates directly into $0.03 of scrap cost per carton.
The best conversations happen when a client remembers an order where half the cartons returned for rework and says, “I don’t want that again.” That sentiment, more than any glossy sample, refocuses attention on how many usable units actually boarded the truck bound for the Seattle retail partner.
Specifications That Influence Packaging Yield per Order
Material Choices
Paperboard grades, coatings, and laminations shape what is packaging yield per order in tangible ways; a 16-point SBS with matte aqueous coating milled at Chengdu Paper Mill usually yields 92–95%, while a 24-point coated recycled board with satin UV from Shanghai Recycling Paper drops to 86–88% according to stress data from the Institute of Packaging Professionals 2021 study and ASTM D685 tables.
Tooling and Structural Complexity
Intense folds and pop-up features increase setup time and scrap. On the Tianjin prototype line, a pop-up sleeve required a second die pass and two assembly touchpoints, adding 3–4% waste on a 5,000-unit run compared to a straight tuck closure with the same 90mm vertical height.
Print Coverage
Full-coverage ink coverage explains why saturated areas can kill yield; at Guangzhou’s print hall, full-bleed PANTONE 186C bumped spoilage from 6% to 11% because the ink dried unevenly and kiss cutting didn’t release cleanly during the midnight shift.
Here’s a decision table I share with buyers when discussing branding tweaks:
| Specification Change | Impact on Yield per Order | Tipping Point | Recommendation |
|---|---|---|---|
| Switch to recycled board + satin UV | Drop 4-6% | Runs < 5,000 units | Consider only if customer demands sustainability story |
| Add foil + embossing | Drop 2-3% | Complex folds in same panel | Limit to primary panel, avoid secondary panels |
| Move from matte aqueous to soft touch lamination | Neutral change | Assembly automation | Proceed, keep die lines sharp |
Those numbers feed version 9.4 of the Custom Logo Things quoting engine so we can link material nuance to the packaging design you want without pretending there isn’t a measurable cost to the aesthetic.
EPA Region 4 documentation on packaging waste plus our SPC reports from Plant 3 in Foshan confirm that every additional finish adds at least 1.2 percentage points of waste unless we tweak the die path or reduce board stress. That’s why I always ask clients to let us run a finisher’s simulation before locking in treatments.
Honestly, I think most teams shrug and say, “We can make it look sharp,” but what they mean is “I can make it look sharp even if yield drops.” I try to be the voice that says, “Cool, let’s tweak that foil combo so we don’t shoot ourselves in the foot.” The pressman even appreciates the apology before the 9:00 p.m. run.
Pricing & MOQ: Cost Drivers Behind Packaging Yield per Order
What is packaging yield per order if not the engine behind tiered pricing? When yield slips below target, we adjust the price curve so a $0.18/unit cost at 10,000 pieces becomes $0.22/unit at 2,000 pieces because scrap rises approximately 6%—those updates are shared with Atlanta procurement to avoid surprise fees.
Buffer stock and overage policies are weathered by yield figures; a 92% usable run makes the remaining 8% part of our overage strategy, adding 160 units to a 2,000-unit shipment from the Memphis warehouse and affecting landed price on the next order. Clients asking how to reduce MOQs hear this: boosting yield lets us amortize tooling faster, shifting the break-even point lower once a pilot hits 94%.
We also use yield benchmarks to explain step-up costs instead of hiding them in a “setup fee.” When we hit 96% yield, a tooling retainer drops from $1,200 to $700 because Dongguan’s die shop needs less rework during pilots and can lock plates more quickly.
The comparison chart breaks down base price per unit across three MOQ tiers with expected yield shifts:
| MOQ Tier | Base Price per Unit | Target Yield per Order | Expected Scrap Units |
|---|---|---|---|
| 2,000 units | $0.22 | 92% | 160 units |
| 5,000 units | $0.19 | 94% | 300 units |
| 10,000 units | $0.17 | 96% | 400 units |
Your procurement team sees that a 2% lift in what is packaging yield per order translates to another $0.01 savings when runs grow from 5,000 to 10,000 pieces while keeping MOQ manageable for a Florida seasonal release.
Transparency also means showing clients how internal yield dashboards compare to the quoted target in real time; I walk through this with every new wholesale partner and reference the Wholesale Programs documentation so they understand how we track overage, rejects, and SPC anomalies coming from the Ningbo factory.
When the numbers don’t line up, I get a little theatrical—maybe it’s the drama major in me—but I pull every scrap log, every SPC chart from the past 30 days, and at least one sticky note labeled “Yield is king” dated May 14 to show what’s happening. Real-time tracking keeps clients from wondering why costs crept up without explanation.
Process & Timeline: Delivering Packaging Yield per Order Consistently
Our four-stage process—CAD (SolidWorks 2023), pre-press, die, and final QA—each owns a checkpoint for what is packaging yield per order, and assigning responsibility eliminates the blame game that haunted my first packaging review in Los Angeles when no one owned the 8:00 a.m. spoilage report.
Lead times shrink when yield targets are shared early; proof approvals moved 12% faster on a promotional retail drop once we embedded those targets into the digital proofs and required sign-off from the product owner before releasing to die, shrinking the proof-to-die window from five to four business days.
The cyclical review rhythm keeps yield measurable: design captures structural needs, pre-press calculates imposition, die tracks spoilage, and pilot runs finalize the yield number. Every change lands in a shared Slack folder so future iterations begin from the same baseline with notes about the 0.3mm die adjustment.
To keep slippage from eroding yield, I recommend digital sign-offs and dashboards that update scrap counts as operators pull them. One Portland client cut average spoilage by 3.5% simply by adding a QR checklist to the pilot run that triggered an alert when ink density exceeded the 1.2 g/m² plan.
This process is not theoretical; we use SPC reports referenced in ISTA 6-Amazon protocols to capture what is packaging yield per order during production and compare them after each shift to confirm the line stays within the quoted ±2% tolerance.
And yes, telling a production line to “keep an eye on yield” sounds about as useful as asking the press to “just do better,” so we made the metric a scoreboard with bright green, amber, and red indicators every time a shift finishes at the Shenzhen plant. Nothing motivates like a little color-coded shame, right?
Why Choose Us: Packaging Yield per Order and Partnership
Custom Logo Things frames every quote, sample, and pilot around what is packaging yield per order because seminars at packaging.org in Austin and late nights in the production office taught me clients who focus solely on aesthetics end up with inconsistent deliveries and extra costs totaling $1,200 over six weeks.
Our collaborative estimators and data-driven prototyping helped an apparel brand in Los Angeles improve yield per order by five points, cutting waste by 15,000 units after we replaced manual inspection with inline vision checks tied to the live SPC feed.
After-action insights deepen partnerships: every shipment generates a report, SPC metrics highlight trends, suppliers send coil data, and we use those signals to adjust die offsets on the next batch so packaging design stays consistent without surprises.
Service differentiators include dedicated consultants, transparent dashboards, and SPC-grade reports, keeping what is packaging yield per order front and center without the fluff other sites try to hide behind; this is relationship management with numbers filtered through Custom Logo Things Service Platform 3.2.
I’ll admit, some days I miss the simplicity of pulling a sample off the rack, but then I remember the scramble when yield numbers didn’t match the promise—and honestly, that keeps me glued to every dashboard until the final carton ships.
Next Steps to Improve Packaging Yield per Order
Start with this checklist: audit your current orders, define acceptable tolerances, and schedule a materials review with our team; include scrap rates like the 7.2% recorded on SKU 105 and reject logs for each SKU so you can benchmark the next projection.
Adopt practical tools such as yield calculators, QA scorecards, and digital dashboards before the next order. I bring a locked-formula Excel template to every meeting and ask clients to plug in their last three runs for comparison.
Our onboarding process is structured: data exchange, proofing milestones, and production sign-off. Providing artwork files, target output levels, and quality tolerances upfront lets us manage what is packaging yield per order expectations with clarity.
Send last order data and we’ll return a free yield-per-order snapshot within 48 hours that highlights savings and shows how specification tweaks—like reducing ink coverage from 90% to 70%—lower your cost per unit by measurable percentages.
Working with Custom Logo Things means seeing packaging decisions through a fact-based lens where custom packaging, design, and branding pivot on yield, not just flash, so you can manage ROI with confidence.
That’s why when clients text me at 8 p.m. about whether this new 360gsm board with satin UV will kill yield per order, I respond like a sleep-deprived project manager—firm, a little sarcastic, and entirely committed to keeping the numbers honest.
How do I calculate packaging yield per order for my product line?
Gather total usable units produced versus materials consumed so the denominator reflects actual usage instead of ideal volumes—divide 3,432 sellable cartons by 3,600 incoming die-cut blanks to capture real production capability.
Factor rejects, spoilage, and rework counts—42 rejects from the die-cut station or 18 reworks from assembly make the difference between planned yield and reality.
Express the result as a percentage or cost-per-order figure for benchmarking, especially against previous runs like the May mailer where yield fell from 95% to 92%.
What impacts packaging yield per order the most?
Material specifications such as switching from 250gsm SBS to 350gsm C1S drive scrap, particularly when you move from simple cartons to multi-piece rigid boxes with six glued seams.
Print coverage and finishing touches introduce waste, as full-bleed PANTONE 186C adds tension to the board and affects die removal during night shifts.
Process inefficiencies during prototyping or change orders lower overall yield, so keeping revisions limited to two cycles helps maintain higher yield per order.
Can improving packaging yield per order reduce my MOQ?
Higher yield usually lets us offer lower effective MOQ because less waste means more sellable units from the same run, letting a seasonal brand do 3,000 units instead of 5,000 when yield climbs from 92% to 96%.
MOQ decisions still account for tooling amortization and run length, but yield improvements shift the break-even point, giving you more negotiating room for Q3 launches.
We model these scenarios with actual numbers so you see the direct impact on order quantity instead of guessing.
How does our team monitor packaging yield per order during production?
We deploy real-time SPC data to flag deviations before they escalate, with dashboards updating every four hours per shift and alerts tied to the MES in Foshan.
Daily reports compare actual yield to the quoted target so you instantly see whether a line is trending up or down, and we log the comparison in a shared Google Sheet.
Post-run analytics inform the next order, keeping packaging yield per order consistent and predictable.
What should I provide to get a better packaging yield per order estimate?
Share previous order data, defect logs, and material change notes; those specifics show exactly where yield slipped, like the March tear-down logs showing 8% spoilage in the die station.
Provide desired output levels and quality tolerances so we can align production to your expectations, especially if you aim for 5,000 units within 15 business days.
Include artwork files so we can assess print coverage and structural demands, which are critical inputs for yield modeling.
Understanding what is packaging yield per order unlocks ROI—every percentage point higher equals another 120 sellable units on a 6,000-unit run, so put your numbers on the table and let’s improve them together.
Explore our Custom Packaging Products and trust the process because we document every step, from 0.25mm die clearance to the 12–15 day delivery cadence; for questions, visit our FAQ page, and for high-volume needs, our Wholesale Programs lay out the yield-focused advantages.
Even EPA Region 2 notes that optimized packaging mitigates waste, and that’s why every Custom Logo Things partnership is anchored in yield intelligence rather than vague promises.
Actionable takeaway: audit the most recent run, map the actual yield, and lock in the tolerance thresholds before the next order so you can spot deviations early and keep operations stable.