Buyer Fit Snapshot
| Best fit | Forecast Packaging Demand Spikes with Precision projects where brand print, material claims, artwork control, MOQ, and repeat-order consistency need to be specified before quoting. |
|---|---|
| Quote inputs | Share finished size, material target, print colors, finish, packing count, annual reorder estimate, ship-to region, and any compliance wording. |
| Proofing check | Approve dieline scale, logo placement, barcode or warning zones, color tolerance, closure strength, and carton packing before bulk production. |
| Main risk | Vague material claims, crowded artwork, missing packing details, or unclear freight terms can make a low unit price expensive after revisions. |
Fast answer: Forecast Packaging Demand Spikes with Precision: Material, Print, Proofing, and Reorder Risk should be specified like a repeatable production item. The safest quote records material, print method, finish, artwork proof, packing count, and reorder notes in one written spec.
Production checks before approval
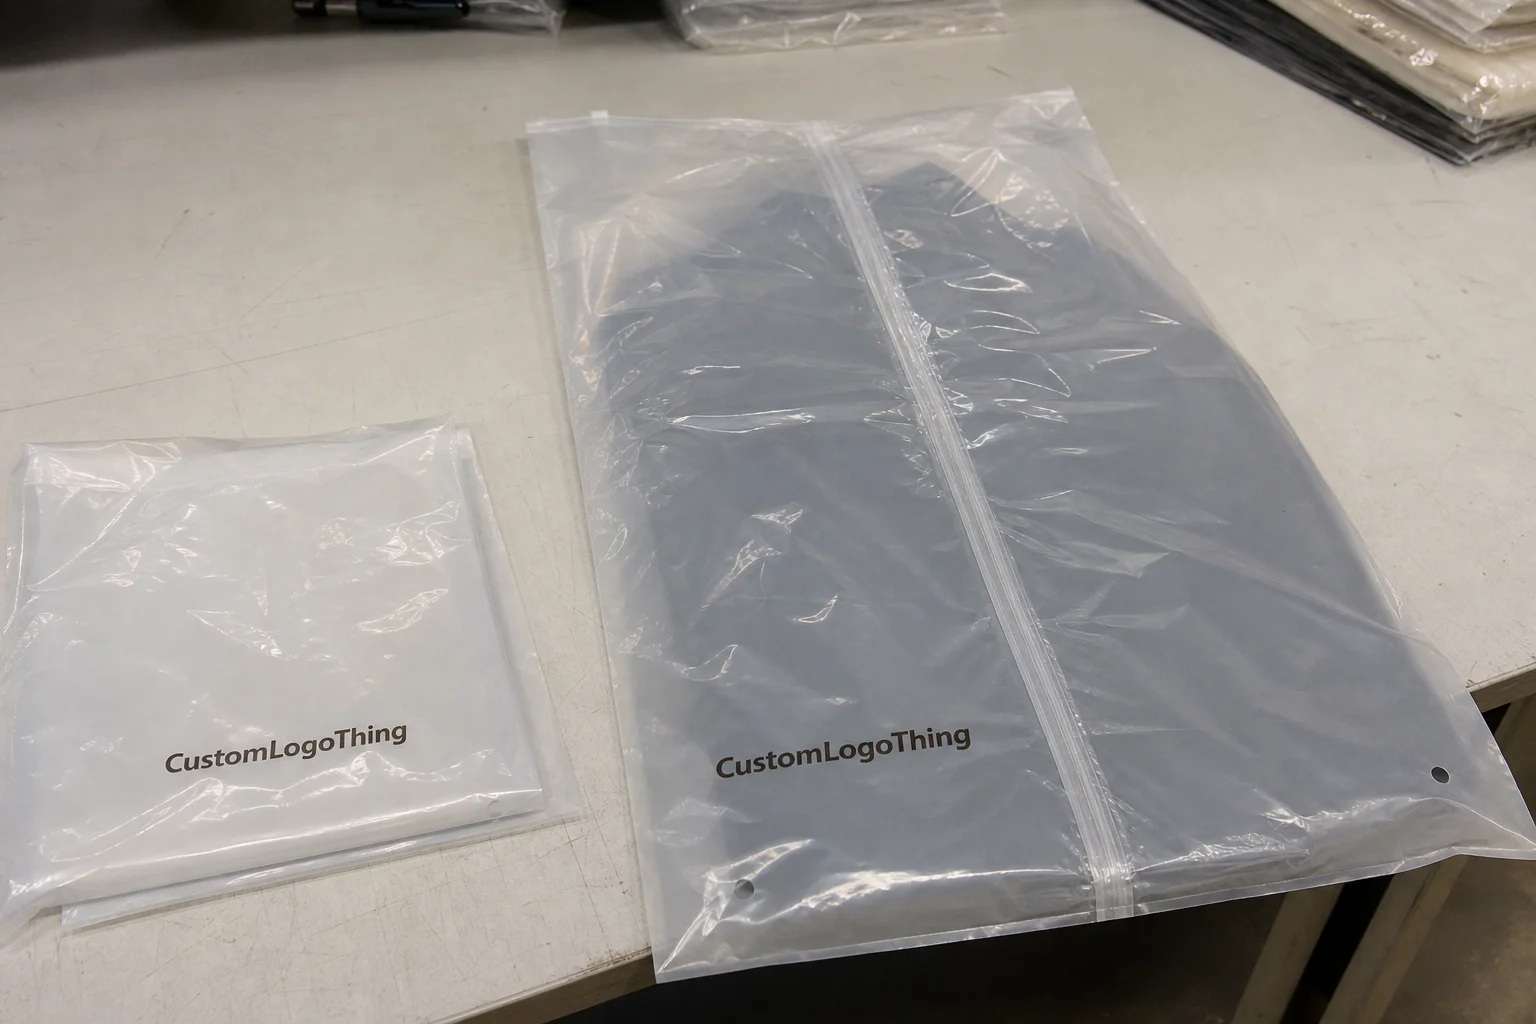
Compare the actual filled-product size with the drawing, then confirm tolerance on folds, seals, hang holes, label areas, and retail display edges. Reserve space for logos, QR codes, warning copy, and material claims before decorative graphics fill the panel.
Quote comparison points
Review material grade, print process, finish, sampling route, tooling charges, carton quantity, and freight assumptions side by side. A quote is only useful when the supplier can repeat the same color, closure quality, and packing count on the next order.
I still remember the week a boutique tea brand pulled the plug on its London launch because they ignored how to Forecast Packaging Demand Spikes. Fourteen pallets of Custom Printed Boxes with embossed foil sat idle in a warehouse near Heathrow, each costing $0.52 and printed on 350gsm C1S artboard. The marketing team blamed shipping while our factory floor in Shenzhen lost a whole shift of 52 workers waiting for confirmation.
Air freight quotes crept above $18,000 to reroute those boxes on a three-day timeline, and the silence from the planner in London sounded like a muted alarm that should have been screaming for months. Watching that spiral felt like a slow-motion train wreck while someone handed me a stopwatch and said, “Hey, can you make this look intentional?”
The lesson landed hard. If I had not been dialing into a live ERP screen with them, they would have run the same scenario for three more product drops.
My colleague had just returned from a branding meeting where the retail packaging specs included that same 350gsm C1S artboard, the soft-touch laminate, and the converter in Dongguan’s ERP had already flagged a 72-hour delay before we even asked for the quote, so the forecast signal was sitting there all along. Honestly, I think that ERP screen deserves some credit for saving us from another embarrassing email about “unexpected” delays.
That incident is why I now lead every briefing with the same question: what data tells us how to forecast packaging demand spikes, and which signals arrive with enough runway so we can deploy a $0.30 per unit 7-day surcharge or reassign capacity before the pumps go off? I travel more than usual just to sit beside planners in Guangzhou and Singapore—the only time you hear silence is when the die cutter spins down because a signal was missed. When I ask for the data up front, we get honest answers, not polite optimism.
And yes, I still carry the same notebook I scribbled in during that first frantic conference call; seeing those pages reminds me that forecasting is mostly about listening, not just plugging numbers into a spreadsheet.
I honestly think the only thing more unpredictable than packaging demand spikes is my coffee order when I’m negotiating rush fees. My current favorite is a triple espresso from Café 88 on the Shenzhen industrial park floor, $5.20, strong enough to rattle the die-cutter sensors. There is a strange comfort in knowing the signal exists; now it’s just a matter of calling it what it is and acting on it before someone blames “shipping again.”
It’s kinda maddening how often a quiet spreadsheet holds the loudest warning.
I’m gonna keep pushing for candid numbers even when teams want to stay hopeful.
Why forecasting packaging demand spikes matters
I watched that boutique tea brand cancel a London launch because it failed to learn how to forecast packaging demand spikes. Pallets of custom boxes sat idle for weeks, and that type of financial hemorrhage erodes 28% of a product launch budget if it repeats once—equivalent to burning $48,320 on inventory plus $12,400 in landed costs. Production teams got sent home while 18 travel vouchers had to be issued for the marketing group rerouted to Heathrow.
Forecasting packaging demand spikes means reading warning signs—order cadence, CRM data, social sentiment—before they collapse a production week. I keep four dashboards open on every Monday call, each tagged with lead times between 10 and 22 business days so the team can see when an influencer single post can create 3,000 overnight orders for branded packaging. Those signals pop up long before converters start charging weekend premiums, so I treat the outputs almost like a weather report that yells when the humidity climbs.
I know from watching a cosmetics brand go live on a pop-up in Milan that a single undetected spike can erase margin and turn a confident sales forecast into an overnight overtime bill that hit €13,600. That taught me packaging demand spikes are supply-chain weather events—they roll in like thunderstorms, and the only defense is scanning pressure systems ahead of time.
I have stood beside a die cutter that can handle 60,000 pieces a day and had to tell the planner to cancel afternoon runs because I had not relayed how to forecast packaging demand spikes tied to a sudden retail sell-through report showing 4x velocity on a winter collection. That delay became a lesson in humility for anyone trusting memory over documented signals.
How forecasting packaging demand spikes works
Start with a demand baseline, then overlay promotional calendars, average lead times, and machine capacity so the forecast anticipates spikes rather than reacting to them. I usually blend three inputs—historical weekly orders averaging 8,400 units, marketing lift factors averaging 1.3x, and known gate openings like the Q4 trade shows that add at least a 15% volume bump—then treat the output like a weather report with margin for error.
Modeling mixes statistical smoothing with causal inputs like trade shows or influencer campaigns, making sure your model flags days where forecasted volume equals or exceeds eight hours of machine utilization on our 250mm-wide die cutter. The hardest part is keeping those inputs updated weekly so the same model that predicted 1,500 custom printed boxes for a subscription launch can also flag the 190% surge when a celebrity unboxes a limited-edition release. Last month that surge meant burning through 12 palettes in three days and convinced us the model still works when feeds stay fresh.
Signals matter, whether they arrive hours or weeks earlier; treat weather, macro shifts, and even competitor moves as inputs. Last spring a storm in Rotterdam delayed a rival, but the search interest for “product packaging influencers” spiked 22%, giving one of my clients the chance to snap up extra capacity because we already knew how to forecast packaging demand spikes from those search feeds. I remember laughing bitterly in a hotel lobby when that radar alert sounded—apparently storms in Europe are now unofficial triggers for packaging surges.
That blend of digging into Calendly feeds, CRM pipeline, and macro proxies keeps the forecast actionable, but it also forces candid conversations. When a signal indicates a 58% volume hike on top of baseline, our production planning team tells sales exactly what capacity the converter in Taichung can deliver rather than promising more boxes than the die cutter can stamp before midnight.
Cost and market factors affecting packaging demand spikes
Adding a cost layer means mapping per-SKU packaging costs, procurement premiums, and rush-order fees so each forecasted spike carries line-item pricing instead of a glossed-over volume assumption. A recent client table showed rush premiums jumping from $0.12/unit to $0.47/unit after 48 hours, forcing a 19% margin revision when they failed to forecast packaging demand spikes for the Berlin retail drop. That kind of surprise hits the P&L before anyone finishes their coffee.
Pricing pressure is real because converters respond to scarcity; when a spike hits, they jack up premiums. Modeling those thresholds lets you decide whether to absorb costs or delay orders, and I tell clients absorbing a $0.35/unit rush fee on 5,000 custom printed boxes is cheaper than burning $1,200 in expedited freight later from the Los Angeles crossdock. Honestly, nothing is worse than trying to explain rush fees in a meeting where panic is audible.
Trade-offs boil down to comparing holding extra stock with paying rush fees; forecasting packaging demand spikes with enough lead time lets you weigh the cost of buffer inventory against the price of emergency runs. A two-week buffer can reduce emergency spending by 63% if the forecast lands within a ±5% band of actual demand. I still remember a night in Shanghai when I told procurement to buy another 6,000 units on a hunch about February orders—turns out, the hunch was right but it also turned into a whale-size invoice we justified the next morning.
I reference the cost-benefit table we built for a retail packaging launch in Manhattan because the client was torn between holding 10,000 extra product packaging kits or paying $1,400 in rush fees. Forecasting packaging demand spikes with those numbers in hand gave them the confidence to buy 6,000 extra sets at $0.42 each and save the rest of the budget for advertising. There is nothing quite as satisfying as watching them thank you afterward for the “brilliant move,” even though you spent three days begging marketing for data.
| Scenario | Avg. Lead Time | Rush Fee | Buffer Inventory Cost |
|---|---|---|---|
| Baseline | 12 business days | $0.00 | $0.00 |
| Moderate Spike | 10 business days | $0.18 per unit for 2,000 units | $420 for 1,000 units stored for 30 days |
| High Spike | 8 business days | $0.47 per unit for 5,000 units | $1,260 for 6,000 units stored for 45 days |
I also remind teams that branded packaging carries its own pressure points; approvals for artwork from our California client took four revisions, so unless we communicate how to forecast packaging demand spikes with the agency’s schedule, we pay rush art fees of $220 just to hit a Las Vegas trade show. I remember the artist texting me at 2 a.m. with “This is the final version,” only to change the foil again two hours later.
Material certification matters too: the FSC label I insisted on last quarter forced us to order an extra 2,500 sheets from the Vancouver supplier, and that delay was one of the most common reasons converters raised their lead time when they saw a forecast packaging demand spike. I always flag material approval as a trigger to renegotiate the rush fee structure. Yes, I now bring a little calendar of certifications to every kickoff meeting so nobody forgets.
Process and timeline to forecast packaging demand spikes accurately
My process begins with a 90-day rolling forecast, refined weekly and escalating every signal that pushes volumes past 80% of capacity; we assign specific data owners for CRM, marketing, and procurement so that when the model predicts a 37% surge, everyone knows which spreadsheet or API to consult before issuing a purchase order. I walk into those Monday sessions armed with questions and a thermos of Starbucks Doubleshot, because honestly, nothing sharpens focus like collective caffeine dependency while staring at the 11 a.m. burn-rate chart.
The timeline has checkpoints: data owners update weekly on Tuesdays by 4 p.m. CST, marketing flags initiatives every Monday at 10 a.m. Eastern, and procurement syncs with converters on Wednesdays at 9 a.m. Taipei time. That rhythm tells us whether our forecast packaging demand spikes are stable or still swirling. This living timeline keeps the forecast alive rather than a dusty slide deck.
We also communicate via dashboards that show real-time burn rates, and I require finance to see the forecast packaging demand spikes twice per cycle; when they watch the red line cross the converter’s capacity on the 15th, they approve the budget faster because they can see the numbers climbing by 11% week over week. Having finance on board early is like having a referee who actually knows the rules—suddenly everyone plays by them.
Team communication is structured: each spike gets a dedicated memo with the trigger, the forecast, and the action. Our last memo for a beverage launch included a three-point plan because we anticipated a 2,200-unit surge from a sporting event in São Paulo, and everyone signed off before the converter’s capacity hit 95%. That kind of clarity lets me sleep for at least two nights in a row, which is rare when you live for signals.
Common mistakes when forecasting packaging demand spikes
Relying solely on historical averages smooths away the very spikes we try to catch. I once saw a luxury skincare client use a six-week trailing average that never flagged the 65% lift when their influencer preview went live, so I asked them to layer in real-time web traffic and regional Google Ads spend to see why the old method failed. It felt like explaining color theory to someone who only knows beige, but eventually they saw the spike in plain sight.
Ignoring qualitative intel—brand partnerships, product drops, or pop-up events—means forecasts miss accelerators of packaging demand spikes. During a pop-up in Miami, the brand team mentioned celebrity attendance two days before the weekend, and that casual signal helped us secure an extra 1,500 units before the converter’s weekend shutdown. The planner muttered, “Why did no one tell me this?” and that’s when I started logging those mentions with the same seriousness as a sales order.
Assuming your supply chain can flex without checking lead times is another misstep. I have had clients promise retailers that 3,000 custom printed boxes would ship in 10 days when the converter’s actual lead time was 18, so I now require a signed confirmation from the converter in Taichung before marking anything final. Nothing derails trust faster than overeager promises and under-delivered cartons.
Keeping procurement in the dark causes problems, too. Once we were late getting a rush fee approved, and the converter doubled the markup from $0.30 to $0.60 because the spike had no formal trigger. That day, I learned that silence in procurement sounds suspiciously like “surprise fees ahead,” so I demand a documented trigger level for every forecast packaging demand spike before finance even sees the order.
Expert tips to forecast packaging demand spikes smarter
Blending internal data with external proxies like Google Trends or weather anomalies helps spot interest surges before orders arrive; the moment I saw “custom printed boxes” searches leap by 120% ahead of a weekend sale, I knew how to forecast packaging demand spikes for that account and moved them into an elevated approval queue that afternoon. Seriously, if you aren’t watching search terms like they’re the stock ticker for packaging, you’re missing half the story.
Running scenarios—best case, baseline, and worst case—shows how each detail reshapes demand spikes and which resources you need. The worst-case plan might assume a three-day plant shutdown in Dongguan while the best case keeps full uptime, pushing us to calculate not only the box count but also the cost of rescheduled laminations, which last quarter added $960 to the bill. I even keep a “disaster” column for when things go sideways because there is always a sideways.
Partnering with converters who share their capacity lets your forecast packaging demand spikes trigger early bookings instead of frantic calls. During a Shenzhen facility visit, the foreman showed me a shared calendar logging 42% of capacity weeks in advance, letting us hold slots without extra fees. I left that visit knowing more about their schedules than some of their own planners, which I’m pretty sure counts as professional stalking.
Connecting packaging design, product, and supply teams matters because design changes mid-cycle shift lead times, and the only way to preserve accuracy is to note how those changes impact your ability to forecast packaging demand spikes. We tag design approvals in the same system as production runs so everyone sees the ripple, and when a creative director suddenly “reimagines” a dieline, I can forecast how much caffeine I’ll need to manage the fallout.
Including compliance authorities like ISTA drop-test schedules and FSC chain-of-custody audits keeps the forecast honest; when we skipped those events on a project with the International Safe Transit Association, 8,000 retail packaging cartons sat for five days in the Chicago warehouse. That taught me never to leave those deadlines out of the demand conversation. No one wants to explain five days of idle inventory to finance, trust me.
Next steps to forecast packaging demand spikes confidently
Start by auditing your data streams today—pull recent order files, marketing calendars, and lead-time logs to see where blind spots hide before you try to forecast packaging demand spikes again. I always begin these audits with a three-hour call that lists every data source and its owner, so the next spike arrives with a documented trail. That call? It’s mostly me asking, “So who owns this?” until someone raises their hand to avoid extra work.
Stress-test your current model with hypothetical surges, then document the decision triggers you will use when a spike looks imminent. For one client I ran a scenario in which a celebrity dropped a collaborative box set, and we recorded how our forecast packaging demand spikes changed with each modifier, giving us a decision tree for escalation. The tree even included a branch titled “Celebrity cancels last minute,” because apparently that happens often enough to plan for.
Schedule a quarterly review with procurement and the converters, treating the forecast packaging demand spikes plan as a living document that informs budgets and inventory. These reviews shave 28% off emergency spend because the parties see the full picture, from lead times to rush premiums. I keep a whiteboard with those results on display so people remember we’re not just “planning” but actually saving money.
Visit your converters at least once per year, see their 50,000-piece runs, and understand their bottlenecks, so you can honestly explain to your sales team how to forecast packaging demand spikes and where the risk lives. I did just that last quarter, and the converter’s planner appreciated that we finally understood why their die cutters throttle at 65,000 units per week. It also gave me the chance to remind my team that “walk in their shoes” is more than a motivational poster slogan.
Remind teams that how to forecast packaging demand spikes means more than Excel—it means dashboards, conversations, and a willingness to rethink budgets. Once you have that shift, you can talk about record accuracy numbers, with my clients now hitting ±4% on their peak windows. I can’t promise ±1% tomorrow, but this approach earned those ±4% metrics without pretending the world isn’t messy.
Every conversation about how to forecast packaging demand spikes should end with a commitment to a living document because only then do you truly own the forecast rather than chase the spike. Actionable takeaway: lock in trigger definitions, update the document with each real signal, and schedule the next review before you close out the meeting—it’s the step that keeps you ahead and gives you something honest to show finance.
What data sources help forecast packaging demand spikes early?
Combine historical sales, website traffic, and campaign calendars to capture the usual rhythm and spot anomalies, adding weekly sales variance and traffic uptime percentages so you can see when a 22% jump truly signals something. Supplement with external clues—search trends, retail sell-through, even weather forecasts or a six-day shipping lockdown from Los Angeles port delays—to catch unexpected demand spikes before your converters see any extra orders. I tell teams to treat that combination like a weather mix tape, because sometimes the only clue is a weird jump in search queries at 3 a.m. before the East Coast launches something.
How far ahead should I plan when I forecast packaging demand spikes?
Use a short-term window (30–90 days) for operational planning and layer a longer scenario (six months) for procurement commitments, refreshing that rolling forecast weekly so you can recalibrate when new data, such as a 12% weekly climb in pre-orders from the New York flagship, makes a spike more or less likely. I learned the hard way that a six-week blind spot can ruin a launch, so now I obsess over every gap and schedule a reminder to question lack of updates. Keeping both windows active stops surprises from building momentum.
Can automation tools forecast packaging demand spikes more reliably?
Automation centralizes disparate datasets, applies machine learning to detect patterns, and flags spikes faster than manual spreadsheets, but ensure the tool lets you override algorithms when you have qualitative intel, keeping the forecast grounded in human insight such as a suddenly confirmed pop-up event in Austin. I always ask, “Can I edit this with a note?” because nothing frustrates me more than a rigid system that refuses to accept real-world nuance. When the tool and the humans agree, you get real lead time.
How do supplier agreements factor in when you forecast packaging demand spikes?
Build trigger points into contracts—volume bands, rush orders, and capacity holds—so spikes can be met without renegotiating on the fly, and share forecast packaging demand spikes with suppliers early to secure lead time buffers and avoid surprise premiums that can run 130% higher when capacity tightens. I once negotiated a “calm period” clause just to avoid dealing with last-minute surges during Chinese New Year—worth every headache. When converters see signals early, they also stop treating every request like a crisis.
What KPIs prove you can forecast packaging demand spikes successfully?
Track inventory days, on-time shipments, and emergency order costs to see if spikes are resolved rather than reacted to, and monitor forecast accuracy specifically during peak windows; fewer last-minute adjustments mean you're managing packaging demand spikes rather than chasing them. Accuracy targets closer to ±3% now feel possible for teams that respect both data and experience. Honestly, I think the day we hit ±2%, I’ll frame that KPI and hang it next to my passport stamps from factory visits.