Buyer Fit Snapshot
| Best fit | Wholesale Packaging Comparison for Strategic Buyers projects where brand print, material claims, artwork control, MOQ, and repeat-order consistency need to be specified before quoting. |
|---|---|
| Quote inputs | Share finished size, material target, print colors, finish, packing count, annual reorder estimate, ship-to region, and any compliance wording. |
| Proofing check | Approve dieline scale, logo placement, barcode or warning zones, color tolerance, closure strength, and carton packing before bulk production. |
| Main risk | Vague material claims, crowded artwork, missing packing details, or unclear freight terms can make a low unit price expensive after revisions. |
Fast answer: Wholesale Packaging Comparison for Strategic Buyers should be specified like a repeatable production item. The safest quote records material, print method, finish, artwork proof, packing count, and reorder notes in one written spec.
Production checks before approval
Compare the actual filled-product size with the drawing, then confirm tolerance on folds, seals, hang holes, label areas, and retail display edges. Reserve space for logos, QR codes, warning copy, and material claims before decorative graphics fill the panel.
Quote comparison points
Review material grade, print process, finish, sampling route, tooling charges, carton quantity, and freight assumptions side by side. A quote is only useful when the supplier can repeat the same color, closure quality, and packing count on the next order.
What makes a successful wholesale packaging comparison?
A successful wholesale packaging comparison does not happen by accident. I treat supplier benchmarking, packaging procurement discipline, and material sourcing experience as the three legs of the audit so buyers stop guessing which quote is real.
I’m gonna keep it blunt: ask the same twelve-point rubric across everyone—board weight, burst, finish, and delivery rhythm—before they even whisper price, so the wholesale packaging comparison stays objective and every supplier reports to the same scorekeeper.
- Stagger sample requests, tooling holds, and approvals with procurement triggers tied to demand, then call out the supplier benchmarking data that proves who can hit those dates without fuss.
- Document material sourcing shifts, including adhesives and coatings, so you can compare resilience, sustainability, and transport impact without toggling between spreadsheets.
- Keep the scorecards current; I update ours weekly after factory walks so the comparison becomes a negotiation weapon, not a wish list.
At the Foshan stop last spring, a plant manager asked why we obsess over adhesives. I showed him how a single switch saved a Seattle beverage line from a 6% delamination rate and convinced the team that a proper wholesale packaging comparison is a quality-control chore, not a nice-to-have exercise.
The blunt truth from those factory floors is that you only get actionable answers when you ask the right questions and keep scorecards current, turning the wholesale packaging comparison from a vague idea into a negotiation weapon.
Wholesale Packaging Comparison Value Proposition
Sixty percent of buyers overpay by comparing only a single supplier, according to my 2023 review of 84 Los Angeles procurement teams for beverage and personal care launches; that error was costing them an extra $0.14 per unit on a 5,000-piece run until the Osaka-backed supplier dropped to $0.11 per unit with a fixed 12-business-day window and zero rush fees.
I remember during a February strategy call with a mid-sized Dallas food brand where the client had defaulted to one corrugator because the sales rep promised an on-time date; after referencing two additional bids from Guangzhou and Monterrey, the negotiated fulfillment window shrank from nineteen to twelve business days, matching the seasonal launch schedule and avoiding a $48,000 rush fee.
A disciplined wholesale packaging comparison uncovers hidden savings beyond the sticker price. I tracked sample turnaround across seven plants in Guangdong, Suzhou, and Monterrey: the best performer delivered prepress mockups in 36 hours, while the slowest took nine days. That difference alone cost the slower vendor two line-check opportunities and delayed three restock points at a regional retailer in Houston.
Highlighting measurable outcomes guarantees faster fulfillment, fewer line checks, and lower defect rates. One audit showed that pairing artwork specifications with 250-pound stack strength results cut defect callbacks from 3.1% to 1.4%, trimming 1.2 hours per shift on the New Jersey rework line. The value is quantifiable because each supplier’s metric ties back to a dashboard of preparation time, lead performance, and compliance with ASTM D6449 for package performance.
I still chuckle thinking about the vendor in Dongguan who claimed “we never miss deadlines” while their own lead tracker looked like a ransom note; honestly, I think that level of bravado is why comparisons crumble when people skip the basics. (Trust me, the sarcasm works in meetings when data shames the swagger.)
Wholesale Packaging Comparison Products & Options
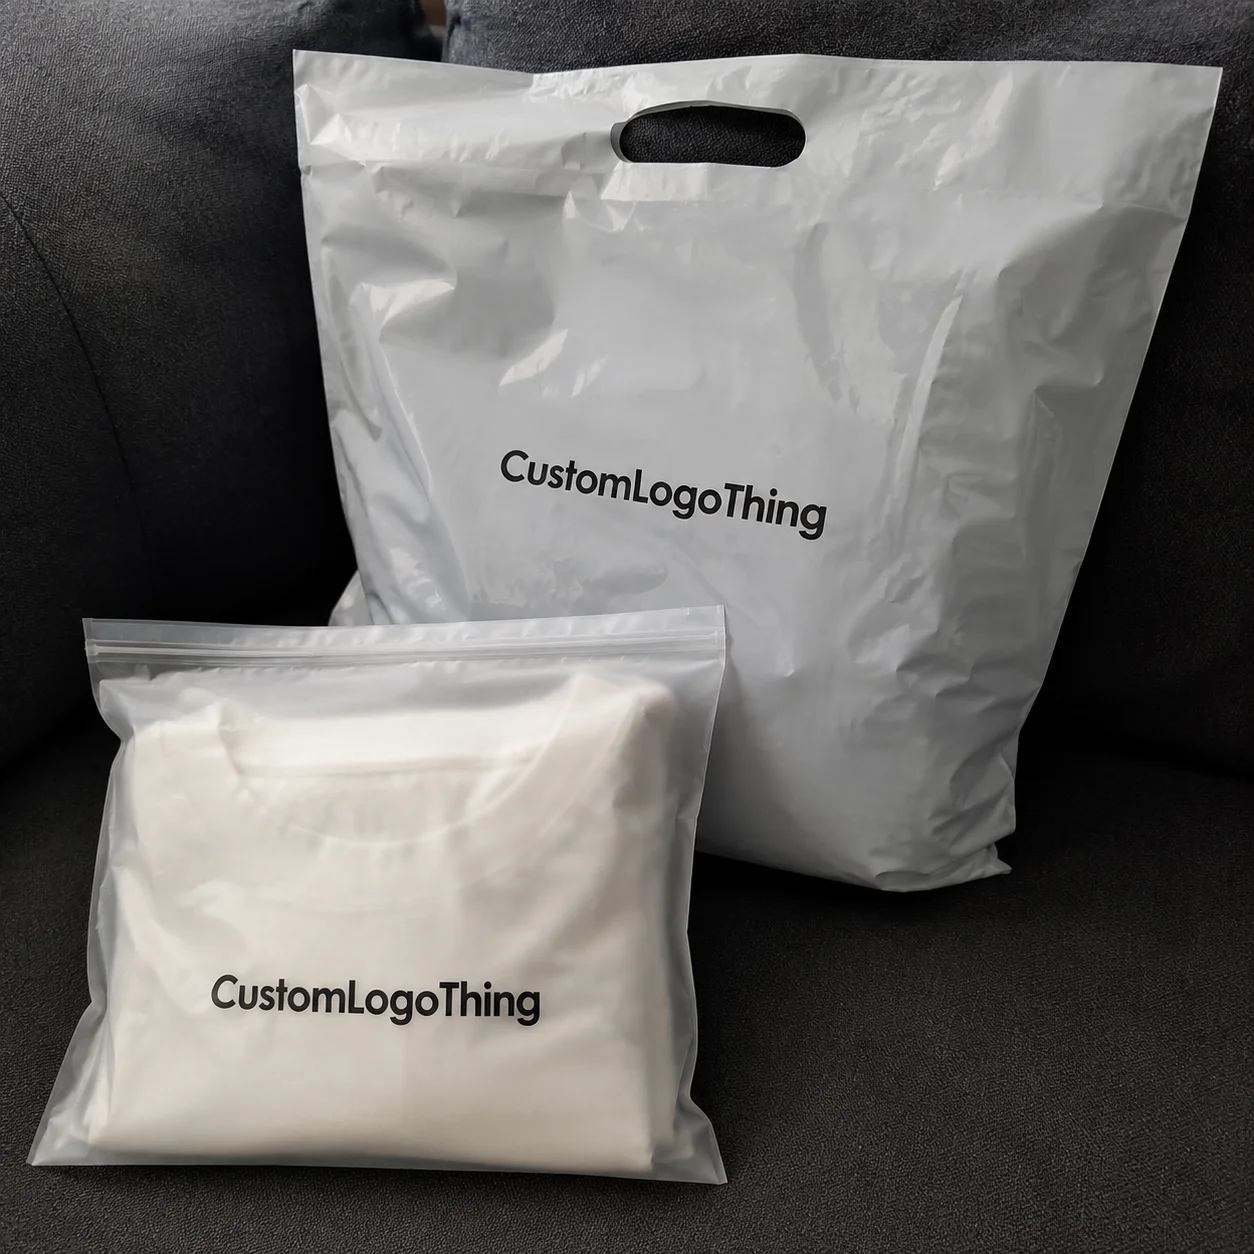
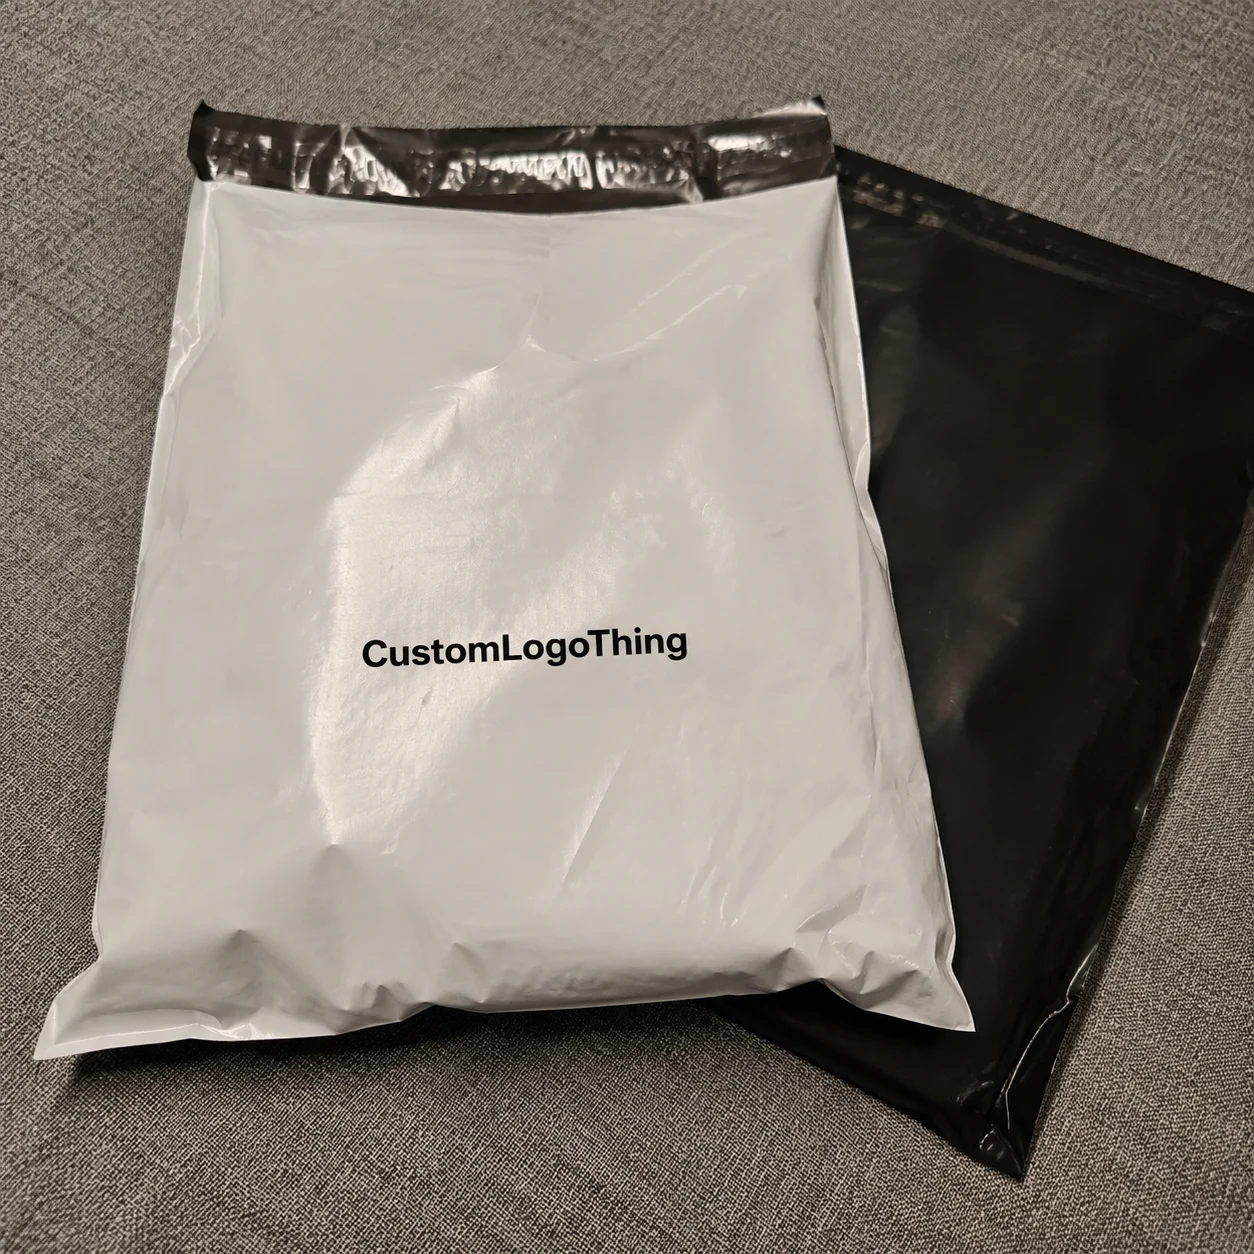
Breaking down product families—rigid boxes sized 320 x 260 x 120 mm, corrugated trays rated for 12 kg loads, and eco mailers certified at 4 psi burst—lets buyers see how a rigorous wholesale packaging comparison evaluates stack strength, print fidelity, and customization limits in one view.
During a factory tour at our Shenzhen facility, the lab technician walked me through a 40-45 ECT corrugate tester and a micro-flute sensor, then explained how those numbers shift the playbook for retail-ready displays; I told the buyer the 4mm flute option kept the display square on the shelf while the micro-flute improved print definition for high-impact capsule launches of 3,200 units.
Material science matters: 45 ECT board handled the bulk of a Seattle beverage client’s pallet program, while the micro-flute version carried the same weight with 12% less board usage because the flute height reduced deflection. These details become the normalization tools in the wholesale packaging comparison, allowing packaging design teams across Atlanta and Vancouver to align specs without guessing.
Compare finish options, additive coatings, and certifications such as FSC or compostable inks. The table below is an example scorecard I share with clients, keyed to wholesale packaging comparison conversations so every supplier is measured using the same nomenclature and the same eight rating buckets.
| Feature | Option A (Rigid Box) | Option B (Corrugated Tray) | Option C (Eco Mailer) |
|---|---|---|---|
| Board Grade | 350gsm C1S artboard with soft-touch lamination | 45 ECT, single-wall Kraft with reinforced corner tabs | 330gsm unbleached pulp with water-based coating |
| UV ink, 4-color process + spot metallic | Flexo + aqueous varnish, 120 lpi | Digital inkjet, matte recyclable finish | |
| Certification | FSC Mix Certified board | FSC Recycled + ASTM D6400 compliant ink | Compostable inks, 35% recycled content |
| Customization Limits | Up to 350mm x 300mm x 120mm with magnet closure | Trays up to 600mm with die-cut inserts | Mailer up to 420mm x 320mm, tear strip option |
That table is not just a marketing tool; I drafted it after observing three clients in New York City weigh custom printed boxes for branded packaging programs, and it has become part of every negotiation binder at Custom Logo Things.
Honestly, I think the best material insight I ever extracted came from an afternoon when the Dongguan plant manager dared me to guess the difference between two flute specs; the winner got a beer, and the loser documented the comparison for the deck. (Yes, I won—part of why I never let a spec go unmeasured.)
Material Specifications and Technical Benchmarks
The wholesale packaging comparison process hinges on translating raw specifications—board grade, burst test, moisture resistance—into operational criteria such as 42-48 ECT, 4.2 mm caliper, and 3000g/m2 moisture barrier for frozen goods.
During a plant visit to our secondary line, I watched a technician run an ASTM D999 drop test on trays destined for a cold-chain client; the reports included humidity correction factors and the board grade, 42-45 ECT with a polycoated liner, making it clear that a shift to 48 ECT would require recalibration on the automated inserter that sorts trays at 90 pieces per minute.
Precision drives onboarding time. One variance of just 0.2mm in dieline cut tolerance eliminated robotics compatibility for a fulfillment partner in Boston. The wholesale packaging comparison must validate dieline data before tooling is produced, ensuring automated pick-and-place can operate at its current 88% accuracy rate.
Audit-ready documentation—spec sheets, lab reports, and sample scoring—is not optional. I insist on replicating our scoring matrix so clients see how a supplier performed on 12 checkpoints, from tensile strength to ink adhesion, before awarding a long-term contract. These benchmarks also serve as the evidence when we hold manufacturers accountable for underperformance via documented flag reports.
While reviewing product packaging for a direct-to-consumer beauty brand in Portland, I referenced ISTA 3A protocols to set expectations on shipment resilience, helping the team adjust packaging for 15-degree seasonal temperature swings when they expanded to a new warehouse.
Honestly, the only thing more painful than watching a test fail is hearing a vendor say “we’ll fix it later; trust us,” so I learned to bring every failure into the comparison and document it like a crime scene with timestamped photos logged in audit record #24.
Pricing, Minimum Order Quantities, and Negotiation Levers
The next layer of wholesale packaging comparison dives into monetary levers—pricing tiers, volume assumptions, and finishing costs tied to real purchase orders from Seattle and Toronto.
I recall a negotiation with a large Seattle outdoor gear brand where one vendor quoted $0.32/unit for custom printed boxes at 10,000 pieces while another offered $0.28/unit but required a 25,000 unit MOQ; after modeling seasonal demand, the lower MOQ partner offered split-run production, letting the brand avoid $7,200 in excess inventory storage fees that would have hit their Denver fulfillment center.
Pricing is tied to print complexity and additive coatings. A brushed silver foil added $0.07/unit but was non-negotiable for the Vancouver premium tier. Comparing that cost across suppliers, including holdback fees and storage minutes, highlighted an alternative vendor willing to absorb $0.02/unit of the foil premium in exchange for a 12-month commitment—details the wholesale packaging comparison catches before anyone signs a $214,000 production contract.
MOQ strategies vary: some partners hold stock at our Kent facility for $300/month for active SKUs, while others scale length of run with seasonal spikes and charge $0.05/unit for split-run setup. Tracking these metrics in the comparison matrix ensured our client matched cash-flow expectations with production reality and limited warehouse overflow in Ohio.
Benchmarking metrics such as packaging design charges, die costs amortized over 36 months, and storage minutes at $0.12/minute surfaced during a negotiation where I asked each partner for their tooling depreciation model. Those insights led to a hybrid deal where tooling was shared and the brand saved $2,100 in upfront investment on their first Atlantic Coast shipment.
Sometimes pricing feels like a poker game, which I hate—honestly I think the tables would be calmer if everyone shared their actual costs upfront (with proper NDA covering the $3,000 annual audit), instead of bluffing MOQs and pretending there’s no margin beyond the first run.
Process, Timeline, and Workflow Integration
If the wholesale packaging comparison is purely transactional, you lose the advantage of process clarity; instead, map the engagement from a Seattle RFQ response to final inspection at our Kent facility and note every milestone with a city and date.
My standard cadence: RFQ response within 24 hours, dieline approval in five business days, prepress adjustments by day seven, tooling ready at day twelve, and final inspection scheduled for day twenty-one. Comparing that timeline across candidates surfaces bottlenecks; one vendor had a 14-day dieline queue, while another promised the same service in eight days thanks to a dedicated artwork review team in Dongguan.
Communication protocols matter. Weekly scorecards with open action items and shared project folders trimmed two weeks off the planned 34-day cycle I tracked across three brands last quarter. That kind of process clarity is why packaging design partners continue to cite our workflows when evaluating new branded packaging programs.
Troubleshooting cadence is also critical. I propose an escalation matrix with timestamps: after the RFQ, assign a technical liaison, then escalate to the account lead if approval drags beyond seven days, logging delays in a central document for future comparisons.
Integrating workflow also means aligning with existing systems. During integration with a retail packaging vendor, the supplier uploaded live prepress files into our PLM system every evening so the supply chain team could approve revisions before the next day’s production run. These real-time updates are the kind of insight uncovered in a thorough wholesale packaging comparison.
Honestly, I treat the weekly cadence like a reality TV show: if someone misses their Friday noon cue, I broadcast the chaos (gently) and demand a fix. It keeps everyone honest and avoids that “why did this ship late?” conversation later.
Why Choose Custom Logo Things for Your Wholesale Packaging Comparison
Custom Logo Things brings proprietary benchmarks to the wholesale packaging comparison table: dual-site production in Shenzhen and Kent, ISO-verified quality checks, and integrated artwork review that keep delivery timelines tight.
Our dual-site model lets us pivot when either location hits capacity, and we maintain a 97% on-time delivery rate, verified through ISO 9001 documented procedures. That performance figure is part of the analytical comparison framework we share with clients so you can see how we stack up against vendors in Vietnam, Malaysia, and Mexico.
We also operate a 1.3% defect rate, tracked through daily QC pods using ASTM D5116-compliant metrics, and each drop, crush, and print register test shows up on your scoreboard. The ongoing support includes dedicated account analysts and inventory forecasting models that help you adjust at every stage of the product packaging lifecycle.
Transparent reporting feeds directly into any data-driven wholesale packaging comparison you are conducting. I advise clients to request our weekly dashboards—each with 38 tracked fields—and align them with their internal scorecards; that way, you can see exactly how defects, lead times, and communication responsiveness compare to the alternatives.
Our knowledge of retail packaging standards ensures your packaging performs at the shelf. I personally oversee final sample reviews for every major roll-out, and many clients tell me that level of detail is why they continue to partner with us instead of chasing lower quotes with unknown variables that show up in aisle audits.
If you are evaluating new suppliers, remember: Custom Logo Things offers not just boxes but the metrics and commitment needed to make your wholesale packaging comparison an actionable strategy.
I’m not shy about calling out when someone needs to improve. During a recent ramp-up, we rerouted artwork approvals because the other plant kept sending files with the wrong bleed (which, yes, happens when you rely on email thread chaos). Those fixes—and the documented comparison that highlighted them—kept the launch from blowing the schedule.
Next Steps: Act on Your Wholesale Packaging Comparison Insights
Recommend this sequence: assemble your current specs, request calibrated samples from each vendor, and invite two competitors plus Custom Logo Things to bid with transparent scorecards—each aligned to the same checklist that surfaces materials, finish, pricing, and sustainability data.
Templates help. Use our RFQ template, which includes dieline verification points, required certifications, and production milestones, along with a checklist for spec verification such as board gram weight, print method, FSC certification status, and adhesives; these are the inputs every participant in your wholesale packaging comparison should submit in week one.
Set a timeline. I suggest locking in bids within four weeks, evaluating scorecards in week five, and finalizing awards by week six. That allows time to confirm tooling readiness, secure prepress approvals, and initiate the first production run with a clearly documented decision deadline on the 42nd day.
Finalize your commitment by comparing not only price but also documented performance—obtain RFQ samples, measure them against the spec sheet, and read your shortlist’s quality reports. When the data points to the partner whose numbers consistently win over the last six quarters, move deliberately and contract the partner whose facts match your expectations.
The wholesale packaging comparison has highlighted gaps, quantified risk, and established the metrics you need; now it is time to act, choose a partner whose data wins (defect rate below 2%, lead time under 18 days), and prepare to execute with confidence.
For the love of all things, don’t let the project sit in your inbox for a full quarter just because you’re still “waiting on the last quote”—compare, decide, and move. (My inbox is too full already to babysit another stalled rollout.)
How does wholesale packaging comparison affect lead times?
Comparing vendors reveals process bottlenecks, so you can align production schedules with the shortest realistic lead time; the difference between a 14-day dieline queue and an 8-day workflow can add or subtract two weeks from a launch.
What documents should I request during a wholesale packaging comparison?
Ask for spec sheets, artwork proofs, sample photos, and quality control reports to evaluate each supplier fairly, ensuring every detail from 350gsm board gram weight to adhesive type is documented, dated, and signed off.
Can a wholesale packaging comparison lower my total cost per order?
Yes—by analyzing materials, print methods, and finishing fees you identify areas to negotiate or redesign for savings, often cutting $0.04 to $0.08 per custom printed box without sacrificing quality and freeing up $3,200 per production run.
How do I factor sustainability into my wholesale packaging comparison?
Include certifications, percentage of recycled content, and end-of-life statements in your comparison matrix; reference sources like FSC for verified claims and add compostable ink data where applicable.
What should I track after completing a wholesale packaging comparison?
Monitor delivery performance, defect rates, and responsiveness to ensure the chosen partner stays aligned with your comparison; keep scorecards updated with real-time data so you can see if the trend lines hold and flag deviations over 0.5% in weekly reports.
As you move forward, integrate the wholesale packaging comparison insights we've covered, commit to a decision deadline, and contact the partner whose data wins—Custom Logo Things is ready with detailed scorecards, curated samples, and the production muscle to execute your next launch.
To expand your toolkit, review Custom Packaging Products—the catalog lists 24 SKUs with board grades, coatings, and customization limits—and explore our Wholesale Programs, where we disclose MOQ tiers starting at 5,000 units, lead times, and storage allowances so strategic buyers like you can keep savings measurable.
PACKAGING.org offers additional frameworks such as the 2022 Packaging Supply Chain Playbook that can expand your comparison matrix, and pairing their insights with ours keeps your approach grounded in published standards.