Buyer Fit Snapshot
| Best fit | Calculate Logistics Packaging Density for Shipping projects where brand print, material claims, artwork control, MOQ, and repeat-order consistency need to be specified before quoting. |
|---|---|
| Quote inputs | Share finished size, material target, print colors, finish, packing count, annual reorder estimate, ship-to region, and any compliance wording. |
| Proofing check | Approve dieline scale, logo placement, barcode or warning zones, color tolerance, closure strength, and carton packing before bulk production. |
| Main risk | Vague material claims, crowded artwork, missing packing details, or unclear freight terms can make a low unit price expensive after revisions. |
Fast answer: Calculate Logistics Packaging Density for Shipping: Material, Print, Proofing, and Reorder Risk should be specified like a repeatable production item. The safest quote records material, print method, finish, artwork proof, packing count, and reorder notes in one written spec.
Production checks before approval
Compare the actual filled-product size with the drawing, then confirm tolerance on folds, seals, hang holes, label areas, and retail display edges. Reserve space for logos, QR codes, warning copy, and material claims before decorative graphics fill the panel.
Quote comparison points
Review material grade, print process, finish, sampling route, tooling charges, carton quantity, and freight assumptions side by side. A quote is only useful when the supplier can repeat the same color, closure quality, and packing count on the next order.
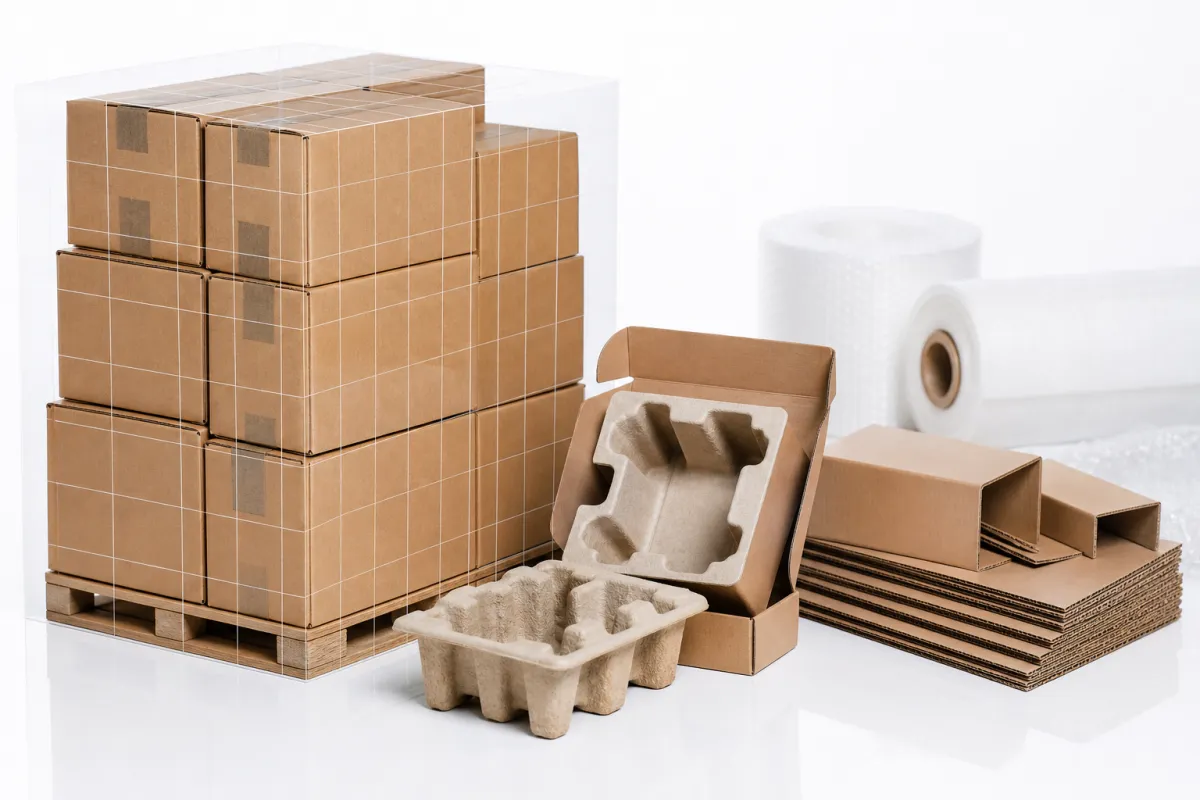
Custom Logo Things
How to Calculate Logistics Packaging Density for Shipping
A carton can look full and still waste 20% to 40% of its volume. That gap is not harmless. It drives up freight, chews through warehouse cube, and can even bump damage rates when products shift in transit. Learning how to calculate logistics packaging density is one of those packaging tasks that pays back in several places at once: shipping, storage, protection, and even package presentation when the outer pack looks cleaner and more deliberate.
Most teams confuse "full-looking" with "efficient." They are not the same thing. A box can be taped shut like a fortress and still be a lousy use of cubic space. That matters whether you ship retail packaging, subscription kits, or Custom Printed Boxes for wholesale fulfillment. The math is simple. The useful part is understanding what the math is telling you. Once you know how to calculate logistics packaging density, the waste starts showing up everywhere: pack lines, pallet patterns, freight invoices, the whole mess.
From a packaging buyer's angle, this is not some abstract metric that lives in a spreadsheet and dies there. It shows up in dimensional-weight charges, extra dunnage, higher carton counts, and those annoying situations where one SKU quietly becomes the cost driver for an entire program. That is why how to calculate logistics packaging density belongs beside corrugate spec, insert design, and product packaging decisions. If the number is off, the rest of the plan is built on sand.
What Is Logistics Packaging Density?
At its simplest, logistics packaging density is the ratio of product volume to total package volume. If the item fills 70% of the finished package, the density is 70%. If the same item sits in a box with lots of void space, the density drops fast. That single number makes how to calculate logistics packaging density useful across shipping, warehousing, and protection planning.
The annoying part for many teams is that a carton can look "packed" and still leave a lot of dead air. A rigid item with odd edges, a foam insert with big cutouts, or a set of nested parts can all create a finished pack that looks tidy but wastes cube. That is why how to calculate logistics packaging density matters for both branded packaging and operational packaging design. Pretty is nice. Wasting space is still wasting space.
A few terms get mixed up constantly:
- Packing density usually refers to how much product volume is inside the package.
- Cube utilization usually describes how well a carton, pallet, or trailer space is used.
- Dimensional weight is a carrier pricing rule based on size, not just actual weight.
That difference matters. A low-density carton can trigger a higher bill even when the product is light. A high-density carton can still be a bad choice if it crushes a fragile item or slows the line. The clean way to think about how to calculate logistics packaging density is as a visibility tool. It exposes inefficiency that tends to hide inside everyday pack-outs.
"A package that ships safely but wastes space is not efficient. A package that saves space but fails transit is not efficient either. The useful target sits between those two failures."
That balance is why many teams compare density alongside ISTA drop and vibration tests, ASTM distribution protocols, and sustainability goals. Packaging pros working with custom packaging products or retail packaging programs usually find that the density conversation uncovers improvements in carton sizing, insert design, and pallet patterning all at once.
For teams wanting a benchmark for test planning, the parcel procedures published by ISTA are useful, and the waste-reduction guidance at EPA helps connect cube efficiency with broader material reduction goals.
How Do You Calculate Logistics Packaging Density?
The short answer is simple: product volume divided by finished package volume, multiplied by 100. That gives you a percentage. If a product occupies 800 cubic inches and the finished carton holds 1,000 cubic inches, the density is 80%. That is the core of how to calculate logistics packaging density, and it works whether you measure in inches, centimeters, or millimeters as long as both volumes use the same unit system.
Here is where teams slip: the package volume is not the carton spec alone. It should reflect the finished pack with inserts, dividers, fill, and product orientation already set. If a SKU ships upright in one pack style and flat in another, the density changes even if the outer dimensions stay fixed. That is why how to calculate logistics packaging density is less about a spreadsheet trick and more about understanding the actual pack line. The number only matters if it matches reality.
Picture two cartons with the same outer dimensions. One uses a molded pulp insert that locks the product in place. The other uses loose void fill and a bigger bag. Same outer box. Different density. The first carton might land at 78% density. The second might sit at 55% or worse. Multiply that gap across volume and you get more pallets, more trailer space, and more freight spend. No drama required. Just math.
Example: a 12 x 10 x 8 inch carton has a total volume of 960 cubic inches. If the product inside measures 10 x 8 x 6 inches, its volume is 480 cubic inches. The density is 50%. If you remove 1 inch of void in every direction by changing the insert, the finished package might drop to 12 x 10 x 7 inches, or 840 cubic inches. The new density is 57.1%. That is a meaningful jump without changing the product itself.
Carriers, 3PLs, and warehouse teams may all read the same number through different lenses. A transportation manager cares about billable cube and dimensional weight. A warehouse lead cares about pallet density and storage. A quality team cares about whether a tighter pack increases damage risk. That is why how to calculate logistics packaging density should be paired with the reason you are measuring it in the first place.
For teams working on package branding or Custom Printed Boxes, density affects presentation too. A box that fits the product more closely often looks more intentional on arrival, which matters in ecommerce unboxing and retail packaging alike. Still, the goal is not to make every box tiny. The goal is to make the box appropriate. That is the practical side of how to calculate logistics packaging density.
How to Calculate Logistics Packaging Density Step by Step
Start with one SKU and one packaging format. That keeps the calculation honest. Do not begin with a mixed cartoning problem or a pallet mixed with returns packaging. Gather three measurements: product dimensions, finished package dimensions, and any inserts or void fill that remain inside the box after packing. Write down the same unit system for everything. That is the cleanest way to learn how to calculate logistics packaging density without creating a measurement circus.
Step 1: Measure the product volume
Use the product's actual outer dimensions, not the catalog spec if they differ. Multiply length x width x height. A product that measures 8 x 6 x 4 inches has a volume of 192 cubic inches. If the item is irregular, use the smallest bounding box that reflects the real packed shape. For mixed parts, total the full packed set, not a single component.
Step 2: Measure the finished package volume
Measure the outside dimensions of the completed pack, including closure. A carton that closes at 14 x 10 x 8 inches has a volume of 1,120 cubic inches. A mailer may be smaller, but the same rule applies: use the finished size, not the blank sheet size. This is where many teams end up with inflated density results, especially if they forget tape, flaps, or protective liners.
Step 3: Divide product volume by package volume
Take the product volume and divide it by the package volume. Using the numbers above, 192 divided by 1,120 equals 0.1714. Multiply by 100 and the density is 17.1%. That is low. It may be acceptable for a fragile item, but it tells you there is a lot of unused space in the shipper. If you are trying to master how to calculate logistics packaging density, this ratio is the number to watch.
Step 4: Convert the result to a percentage and compare pack styles
Write the percentage into a simple scorecard and compare it against alternate packouts. A tray-and-lid structure may deliver 72%. A dunnage-heavy pack may only deliver 46%. A padded mailer for a small accessory might hit 80% or more. Once the numbers sit on one page, packaging design decisions get clearer fast. This is also where how to calculate logistics packaging density starts helping procurement and finance, not just packaging engineers.
Step 5: Test real packs, not just drawings
A prototype can look ideal and still fail in production. Measure a sample run after the pack line has handled it, because the real world changes things: operators overfill voids, folds shift, bags puff up, and inserts sit differently after repeated use. If you want reliable data, measure at least 10 to 20 real packed cartons from normal production, then use the average density rather than one perfect sample. That is the difference between a spec-sheet answer and a usable answer.
Worked example: imagine a standard carton, a padded mailer, and a master case for the same small accessory. The carton might be 12 x 8 x 6 inches, or 576 cubic inches. The accessory volume might be 240 cubic inches, so density is 41.7%. A padded mailer may be 10 x 8 x 2 inches, or 160 cubic inches, but if the product is too bulky it may be impossible without damage. The master case with 12 units could have a density of 78% because the units nest tightly. The point is not that one option always wins. The point is that how to calculate logistics packaging density gives you a consistent way to compare them.
If your team is evaluating new packaging formats, that is a good moment to compare custom printed boxes against simpler shipper structures. The right choice depends on damage history, freight class, and how much presentation matters for the customer experience. Good packaging design keeps those tradeoffs visible instead of hiding them behind one "best" box.
One final check helps more than people expect: compare the calculation against a mixed reality sample, not just a clean prototype. If the warehouse uses extra tape, a different divider, or a slightly larger carton substitute, the density changes. That is normal. It is also why how to calculate logistics packaging density should be treated as a repeatable workflow, not a one-time worksheet.
Key Factors That Change Packaging Density
Several drivers push density up or down, and most of them are controllable. Product dimensions and shape are the obvious ones. A rectangular item is easier to pack efficiently than a curved or asymmetrical one. The less obvious drivers matter just as much: void fill, carton selection, tray design, pallet pattern, and how many units are packed per shipper. If you want to understand how to calculate logistics packaging density accurately, you need to look at these drivers together instead of pretending one knob controls everything.
Fragile goods usually need lower density because protection takes up room. Durable items can tolerate tighter packouts. A glass cosmetic jar, for example, may need more space around it than a stackable metal accessory. A dense pack is not automatically better if the item arrives damaged. The right density depends on product packaging goals, carrier handling, and the kind of transit abuse the SKU actually sees. Real life is rude that way.
Weight changes the story too. A package can be dense in volume and still be expensive if it crosses a carrier pricing threshold or triggers a higher dimensional-weight charge. For many light products, the cube matters more than the actual weight. For heavy items, the reverse can be true. That is why how to calculate logistics packaging density should sit beside a DIM weight check rather than replace it.
Operational reality sets the ceiling. Standardized pack specs, line speed, carton inventory, labor skill, and available void-fill equipment all shape the final number. A theoretically perfect pack may be impossible if the line is moving 20 cases per minute and the team only stocks six carton sizes. I have seen programs that looked tidy on paper and fell apart the moment the warehouse team had to run them at scale.
- Product geometry: Square and stackable products usually achieve better density than odd-shaped items.
- Protection requirements: Fragile items may trade density for lower breakage.
- Packaging materials: Corrugate grade, inserts, and fill method all change the finished volume.
- Shipment pattern: Unit shipper, master case, and pallet pack each produce different density results.
- Standardization: Fewer box sizes can improve consistency, but only if the fit stays close enough.
A useful mental shortcut is to ask whether the density problem comes from the product, the package, or the process. That framing helps teams separate packaging design fixes from operational fixes. It also keeps the conversation grounded when people compare branded packaging, custom printed boxes, and plain shippers that serve very different purposes.
If you need replacement cartons or a fresh packaging format to test, the range of Custom Packaging Products can be a practical starting point because it lets the team compare fit, finish, and space use side by side.
How Packaging Density Affects Cost and Pricing
Low density tends to increase cost in layers. First, it adds material: more corrugate, more dunnage, more inserts, more tape. Second, it adds cube: more cartons on a pallet, fewer units per trailer, more storage space in the DC. Third, it often adds freight cost because carriers price against size as much as weight. That is the practical reason how to calculate logistics packaging density belongs in the same conversation as landed cost.
For light goods, dimensional weight is usually the sharpest pain point. A box that is physically small but too airy can cost more than a slightly heavier, better-fit alternative. For heavier goods, pallet density and case count may matter more. Either way, the lesson is the same: poor density creates friction that shows up on the invoice. If the product is sold with freight-inclusive pricing, a better pack can free enough margin to sharpen the retail offer without changing the product itself.
The material tradeoff is not always obvious. A denser pack may reduce void fill and lower corrugate consumption, but it might require a stronger insert, a more precise die-cut, or a better board grade. Those costs can still be worth it if they prevent damage and reduce freight. The trick is to compare the full system, not one input line. That is a core habit for anyone trying to learn how to calculate logistics packaging density in a commercial setting.
That same logic matters when you are setting pricing. A quote that looks cheap at the carton level can get expensive after DIM weight, extra handling, and returns are added in. A cleaner pack may cost a little more upfront and still lower total landed cost. If you are serious about how to calculate logistics packaging density, the invoice is where the math gets personal.
| Pack Option | Typical Use | Indicative Unit Cost at 5,000 pcs | Density Impact | Notes |
|---|---|---|---|---|
| Standard overbox with void fill | Mixed or fragile items | $0.28-$0.52 | Lower to moderate | Easy to run, but can waste cube and add filler. |
| Right-sized corrugated carton | Most SKU-specific shippers | $0.32-$0.68 | Moderate to high | Often the best balance of space use and protection. |
| Carton with custom insert set | Fragile, premium, or branded packaging | $0.45-$1.10 | High | Higher tooling effort, but can cut damage and improve presentation. |
| Padded mailer or flexible shipper | Small, low-fragility items | $0.12-$0.34 | Very high if size fits | Best for compact SKUs that do not need rigid protection. |
Those ranges are not universal, and they depend on print coverage, board grade, volume commitment, and tooling. Still, they give teams a useful frame of reference. A packaging manager looking at custom packaging products can use the table to compare density gain against unit cost instead of guessing. That tends to produce better decisions than chasing the cheapest carton on paper.
Cost also affects brand perception. In retail packaging and ecommerce, a tighter, better-fitted shipper can feel more intentional. The unboxing experience is cleaner, the package branding looks sharper, and the customer sees less filler. That visual difference matters, but only if the pack survives transport. A good result in how to calculate logistics packaging density should support both economics and presentation.
A denser pack is only a win if it lowers total landed cost without lifting damage claims. Savings that disappear in returns are not savings.
If you want a planning shortcut, measure cost per shipped unit, cost per order, and cost per sellable unit together. That triple view keeps one metric from lying to the team. One inefficient high-volume SKU can distort the whole network, so SKU-level review is usually more useful than a broad average. That is another reason how to calculate logistics packaging density should be run per SKU, not just across the program.
Process and Timeline: From Audit to Better Pack-Out
A small audit can begin quickly, but useful results usually take more than one afternoon. A practical timeline starts with data collection, moves through baseline calculation, then tests alternatives and validates damage performance. That sequence keeps how to calculate logistics packaging density attached to actual operations rather than isolated analysis.
Week one is usually about gathering dimensions, carton specs, void-fill counts, and shipment history. You also want carrier bills, damage claims, and pack-line observations. Week two is for comparison packs: maybe a tighter carton, a different insert, or a changed pack orientation. Week three is where the real proof happens, because test shipments and warehouse feedback tell you whether the new density is stable or just theoretical.
From a team standpoint, the right people need to be in the room early: packaging, operations, procurement, finance, and carrier management. Packaging brings the geometry. Operations brings line reality. Procurement knows whether a die-cut or insert change is practical. Finance sees the cost impact. Carrier management knows how the parcel rules are being applied. If one group is missing, how to calculate logistics packaging density can still happen, but the follow-through may stall.
Typical timeline example:
- Days 1-3: Measure the current SKU pack and capture a sample of real cartons.
- Days 4-7: Build alternative pack-outs and compare density, carton count, and protection needs.
- Week 2: Ship pilot runs and track damage, cube utilization, and labor time.
- Week 3: Review the results, adjust the design, and decide on rollout.
That schedule is realistic for many programs. Some can move faster if the SKU is simple and the warehouse team is already aligned. Others need more time because the item is fragile, irregular, or part of a larger packaging design system. Either way, the workflow stays the same. Measure. Calculate. Test. Document. That is the rhythm behind how to calculate logistics packaging density.
For teams updating a shipper library or revising a branded packaging program, this is also the right point to revisit standard sizes. Fewer carton sizes can simplify purchasing, but only if the fit remains tight enough. A wider box assortment may look inefficient in inventory yet save money in freight and damage. The better answer depends on the shipment profile, not a single rule.
If the project needs a fresh design direction, reviewing custom printed boxes early can save rework later because the fit, print area, and board structure can be planned together instead of patched in afterward.
One useful external standard to keep nearby is the test and transit guidance from ISTA. It gives packaging teams a credible way to validate whether a denser pack is still strong enough for parcel or distribution abuse.
Common Mistakes When Measuring Packaging Density
The fastest mistake is mixing up internal product volume with external carton volume and calling the result a density number. That creates a false sense of efficiency. The calculation has to compare the product against the finished package, not against a spec sheet or a pre-assembly flat. If you are serious about how to calculate logistics packaging density, the boundaries of the measurement need to stay clean.
Another common error is using one sample carton and pretending it represents the entire program. Packout changes with operator technique, product variation, and even time of day if a line is moving fast. A rigid item can sit a little differently in the box from one run to the next. That is why sample size matters. Ten cartons tell you more than one perfect prototype ever will.
Rounding too early also causes trouble. A small measurement error may not matter in a single box, but multiplied across 50,000 shipments it becomes a real cost line. Measure carefully, keep the decimals, and round only at the end. That discipline is a big part of learning how to calculate logistics packaging density in a way that finance can trust.
Protection tradeoffs deserve the most respect. A team may chase a higher density by removing fill or tightening the carton, only to create higher breakage or scuffing. That is not efficiency. That is deferred cost. A denser pack should never be judged in isolation from damage claims. Strong packaging teams compare density against return rate, claim rate, and customer complaints at the same time.
- Do not use product volume alone as the finished density result.
- Do not trust a single sample or a single operator's pack style.
- Do not round away small differences before scaling them up.
- Do not sacrifice protection just to raise the percentage.
- Do not average mixed-SKU or irregular packs into one number.
Mixed kits, returns packaging, and irregular products need separate calculations. A kit with three different items behaves differently than one product in one carton. A return mailer may also need a different approach because the customer has to repack it. If the team uses one average assumption for all of them, the analysis gets fuzzy fast. Better to keep each pack format separate and compare them on equal terms.
A useful shortcut is to look for the SKU that burns the most freight or creates the most claims. That one item often teaches more than a dozen average performers. Fix the outlier and you often improve the entire program. That is one reason how to calculate logistics packaging density is so practical: it surfaces the items that deserve redesign first.
Expert Tips and Next Steps for Better Packaging Density
Once the basic math is in place, the smartest move is to turn it into a scorecard. I would use a simple density sheet by SKU with the product dimensions, finished pack dimensions, density percentage, damage rate, and freight impact. That makes how to calculate logistics packaging density repeatable instead of ad hoc. It also helps procurement and operations speak the same language, which is rare enough to be useful.
For each problem SKU, test three scenarios. First, the smallest safe carton. Second, the best-cost carton. Third, the best-cube carton. Those options are not always the same, and that is the point. A durable item may tolerate a tighter pack without any extra insert cost. A fragile item may need a slightly larger box with a better insert to avoid claims. The right answer depends on the product, the transit profile, and the service level.
Track before-and-after numbers rather than impressions. Useful KPIs include dimensional weight, carton usage, damage rate, pallet density, and pack-line labor time. If the new design saves $0.18 per order but adds eight seconds of labor, the gain may still be worth it. If the damage rate rises by even 0.5%, the freight savings may vanish. That is why how to calculate logistics packaging density should stay connected to performance data.
For teams managing package branding, the opportunity is broader than cost alone. Better-fit packaging often improves the first impression, lowers filler use, and gives the design more room to do its job. That matters in ecommerce, subscription, and premium retail packaging programs. A cleaner outer pack can carry the brand better without turning into waste.
One helpful internal habit is to review the top five shipping SKUs every quarter. That cadence is enough to catch size changes, carton substitutions, and volume spikes before they become expensive. It also keeps packaging design aligned with real shipment data. If a product changes in shape or a supplier tweaks a component, the density score should change too. That is normal, and it is exactly why how to calculate logistics packaging density should be part of ongoing operations.
Here is the practical sequence I would use: measure, calculate, test, document. Measure the pack accurately. Calculate the density against the finished package. Test the design in real handling. Document the result so the next team member does not have to rediscover it six months later. If your organization follows that loop, how to calculate logistics packaging density becomes a durable process instead of a one-off exercise.
For more complex packaging programs, especially those involving custom printed boxes or SKU-specific inserts, it can help to compare board grade, insert geometry, and artwork coverage at the same time. A better density result should support the economics of the whole packaging system, not just one isolated shipper.
That is the practical takeaway: the best teams do not treat how to calculate logistics packaging density as a math problem only. They treat it as a packaging design decision, a freight decision, and a protection decision all at once.
Frequently Asked Questions
How do I calculate logistics packaging density for a carton?
Measure the product volume and the finished carton volume using the same units. Divide product volume by carton volume, then multiply by 100. Repeat the check on several real packed cartons, because field packing often changes the result. That is the simplest version of how to calculate logistics packaging density for a carton.
What is a good logistics packaging density percentage?
There is no universal target. Fragile products may need more space, while durable items can tolerate tighter packouts. A better benchmark is whether the current pack reduces freight, material use, and damage together. Compare density by SKU and packaging type rather than trying to force one company-wide number. That is usually the most honest way to use how to calculate logistics packaging density.
Does higher packaging density always mean lower shipping cost?
Not always. A tighter pack can increase damage risk or require more expensive inserts and board. The best result balances density, protection, and carrier pricing rules. Check dimensional weight, pallet fit, and breakage rates before assuming denser is cheaper. In practice, how to calculate logistics packaging density is only half the decision.
How often should I recalculate logistics packaging density?
Recalculate whenever the product size, carton size, fill material, or pack method changes. It also makes sense during carrier contract reviews, SKU launches, and seasonal volume spikes. For most active shipping programs, a quarterly review is practical. That keeps how to calculate logistics packaging density tied to current operations rather than old assumptions.
How do I calculate logistics packaging density for mixed or irregular products?
Measure the total packed volume of the full assortment, not each item in isolation. Use the outer package dimensions after all inserts, dividers, and void fill are in place. For irregular goods, test multiple packing orientations and choose the safest repeatable option. Mixed kits often need their own method, but the core of how to calculate logistics packaging density still comes down to product volume versus finished package volume.
Final note: If you keep the measurement consistent, compare real pack-outs, and test against transit conditions, how to calculate logistics packaging density becomes a practical tool for lowering cost, improving cube utilization, and making packaging choices that hold up in the real world. Start with the SKUs that cost the most to ship, then work outward. That is where the numbers stop being theoretical and start saving money.

